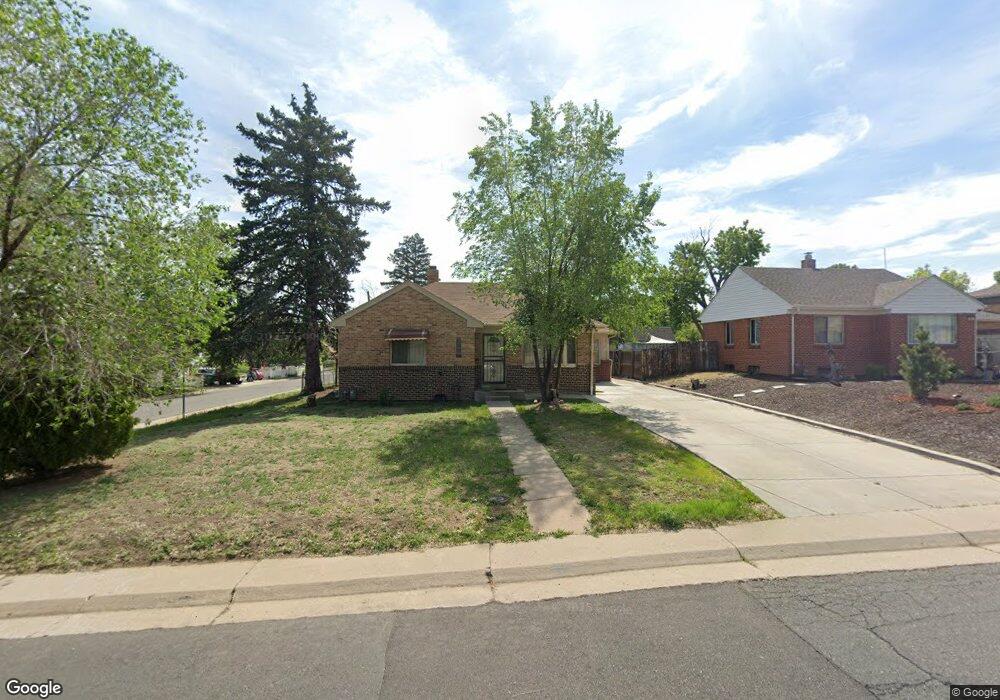
600 S Clay St Denver, CO 80219
Athmar Park NeighborhoodEstimated Value: $504,718 - $614,000
3
Beds
2
Baths
2,292
Sq Ft
$247/Sq Ft
Est. Value
About This Home
This home is located at 600 S Clay St, Denver, CO 80219 and is currently estimated at $566,180, approximately $247 per square foot. 600 S Clay St is a home located in Denver County with nearby schools including Goldrick Elementary School, Kepner Beacon Middle School, and West High School.
Ownership History
Date
Name
Owned For
Owner Type
Purchase Details
Closed on
Dec 30, 2015
Sold by
L & H Apartments Llc
Bought by
A C L Property Llc
Current Estimated Value
Purchase Details
Closed on
Mar 28, 2013
Sold by
Leung Andrew and Leung Sin
Bought by
L & H Apartments Llc
Purchase Details
Closed on
Sep 9, 2011
Sold by
Guild Mortgage Company
Bought by
The Secretary Of Housing & Urban Develop
Purchase Details
Closed on
Sep 6, 2011
Sold by
Fuentes David and Guevara Blanca E
Bought by
Guild Mortgage Company
Purchase Details
Closed on
Aug 25, 2004
Sold by
Dionisio Julia
Bought by
Fuentes David and Guevara Blanca E
Home Financials for this Owner
Home Financials are based on the most recent Mortgage that was taken out on this home.
Original Mortgage
$177,219
Interest Rate
5.97%
Mortgage Type
FHA
Create a Home Valuation Report for This Property
The Home Valuation Report is an in-depth analysis detailing your home's value as well as a comparison with similar homes in the area
Home Values in the Area
Average Home Value in this Area
Purchase History
| Date | Buyer | Sale Price | Title Company |
|---|---|---|---|
| A C L Property Llc | -- | None Available | |
| L & H Apartments Llc | -- | None Available | |
| The Secretary Of Housing & Urban Develop | $187,997 | None Available | |
| Guild Mortgage Company | -- | None Available | |
| Fuentes David | $180,000 | -- |
Source: Public Records
Mortgage History
| Date | Status | Borrower | Loan Amount |
|---|---|---|---|
| Previous Owner | Fuentes David | $177,219 |
Source: Public Records
Tax History Compared to Growth
Tax History
| Year | Tax Paid | Tax Assessment Tax Assessment Total Assessment is a certain percentage of the fair market value that is determined by local assessors to be the total taxable value of land and additions on the property. | Land | Improvement |
|---|---|---|---|---|
| 2024 | $2,659 | $33,570 | $9,870 | $23,700 |
| 2023 | $2,601 | $33,570 | $9,870 | $23,700 |
| 2022 | $2,065 | $25,970 | $14,060 | $11,910 |
| 2021 | $1,993 | $26,710 | $14,460 | $12,250 |
| 2020 | $1,891 | $25,490 | $8,420 | $17,070 |
| 2019 | $1,838 | $25,490 | $8,420 | $17,070 |
| 2018 | $1,519 | $19,640 | $6,360 | $13,280 |
| 2017 | $1,515 | $19,640 | $6,360 | $13,280 |
| 2016 | $1,286 | $15,770 | $5,270 | $10,500 |
| 2015 | $1,232 | $15,770 | $5,270 | $10,500 |
| 2014 | $937 | $11,280 | $2,929 | $8,351 |
Source: Public Records
Map
Nearby Homes
- 601 S Dale Ct
- 527 S Bryant St
- 695 S Bryant St
- 737 S Clay St
- 480 S Canosa Ct
- 740 S Eliot St
- 2251 W Custer Place
- 3073 W Center Ave Unit A
- 3073 W Center Ave Unit C
- 875 S Dale Ct
- 360 S Bryant St
- 2141 W Gill Place
- 3092 W Alaska Place
- 326 S Alcott St
- 2120 W Custer Place
- 3174 W Center Ave
- 980 S Dale Ct
- 3228 W Virginia Ave
- 3145 W Ada Place
- 222 S Canosa Ct