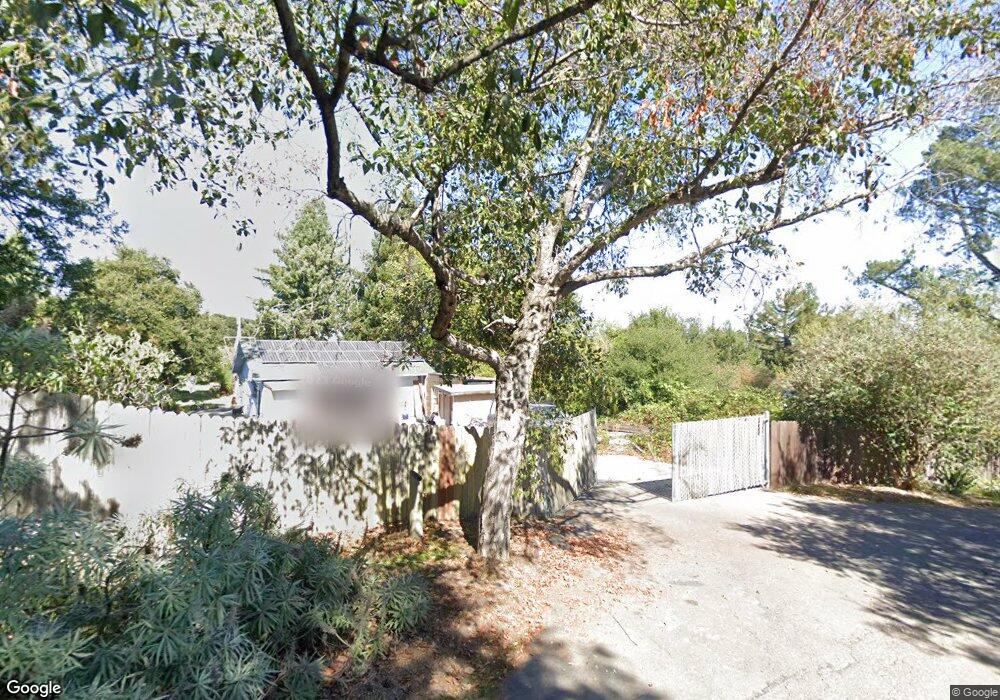
600 Snow Rd Sebastopol, CA 95472
Estimated Value: $1,219,228 - $1,495,000
3
Beds
3
Baths
2,011
Sq Ft
$648/Sq Ft
Est. Value
About This Home
This home is located at 600 Snow Rd, Sebastopol, CA 95472 and is currently estimated at $1,303,057, approximately $647 per square foot. 600 Snow Rd is a home located in Sonoma County with nearby schools including Analy High School, Sunridge Charter School, and Gravenstein Elementary School.
Ownership History
Date
Name
Owned For
Owner Type
Purchase Details
Closed on
Sep 9, 1997
Sold by
Dixon David B
Bought by
Davis Gwyneth
Current Estimated Value
Home Financials for this Owner
Home Financials are based on the most recent Mortgage that was taken out on this home.
Original Mortgage
$96,000
Outstanding Balance
$14,707
Interest Rate
7.34%
Estimated Equity
$1,288,350
Purchase Details
Closed on
May 15, 1996
Sold by
Home Svgs Of America Fsb
Bought by
Dixon David B
Home Financials for this Owner
Home Financials are based on the most recent Mortgage that was taken out on this home.
Original Mortgage
$75,000
Interest Rate
7.8%
Purchase Details
Closed on
Aug 22, 1995
Sold by
Leahy Wayne T and Leahy Colleen Louise
Bought by
Home Svgs Of America
Purchase Details
Closed on
Jan 17, 1995
Sold by
Leahy Colleen L
Bought by
Leahy Wayne T
Create a Home Valuation Report for This Property
The Home Valuation Report is an in-depth analysis detailing your home's value as well as a comparison with similar homes in the area
Purchase History
| Date | Buyer | Sale Price | Title Company |
|---|---|---|---|
| Davis Gwyneth | $288,000 | North American Title Co | |
| Dixon David B | $205,500 | First American Title | |
| Home Svgs Of America | $165,501 | -- | |
| Leahy Wayne T | -- | -- |
Source: Public Records
Mortgage History
| Date | Status | Borrower | Loan Amount |
|---|---|---|---|
| Open | Davis Gwyneth | $96,000 | |
| Previous Owner | Dixon David B | $75,000 | |
| Closed | Dixon David B | $30,000 |
Source: Public Records
Tax History Compared to Growth
Tax History
| Year | Tax Paid | Tax Assessment Tax Assessment Total Assessment is a certain percentage of the fair market value that is determined by local assessors to be the total taxable value of land and additions on the property. | Land | Improvement |
|---|---|---|---|---|
| 2025 | $5,371 | $459,851 | $199,585 | $260,266 |
| 2024 | $5,371 | $450,835 | $195,672 | $255,163 |
| 2023 | $5,371 | $441,996 | $191,836 | $250,160 |
| 2022 | $5,195 | $433,330 | $188,075 | $245,255 |
| 2021 | $5,163 | $424,835 | $184,388 | $240,447 |
| 2020 | $5,192 | $420,480 | $182,498 | $237,982 |
| 2019 | $4,871 | $412,236 | $178,920 | $233,316 |
| 2018 | $4,801 | $404,154 | $175,412 | $228,742 |
| 2017 | $4,598 | $396,230 | $171,973 | $224,257 |
| 2016 | $4,521 | $388,461 | $168,601 | $219,860 |
| 2015 | $4,375 | $382,627 | $166,069 | $216,558 |
| 2014 | $4,290 | $375,132 | $162,816 | $212,316 |
Source: Public Records
Map
Nearby Homes
- 8061 Elphick Rd
- 1430 Santa Maria Way
- 1171 Gravenstein Hwy S
- 7251 Fircrest Ave
- 6781 Evergreen Ave
- 2550 Hwy 116 S
- 5301 Gravenstein Hwy S
- 789 Pleasant Hill Rd
- 7803 Stefenoni Ct
- 340 S High St
- 7720 Bodega Ave Unit 3
- 7225 Bodega Ave
- 5200 California 116
- 3336 Bloomfield Rd
- 7859 Anthony St
- 8086 Bodega Ave
- 200 Pleasant Hill Ave N
- 8148 Bodega Ave
- 5111 Todd Rd
- 0 Bodega Hwy