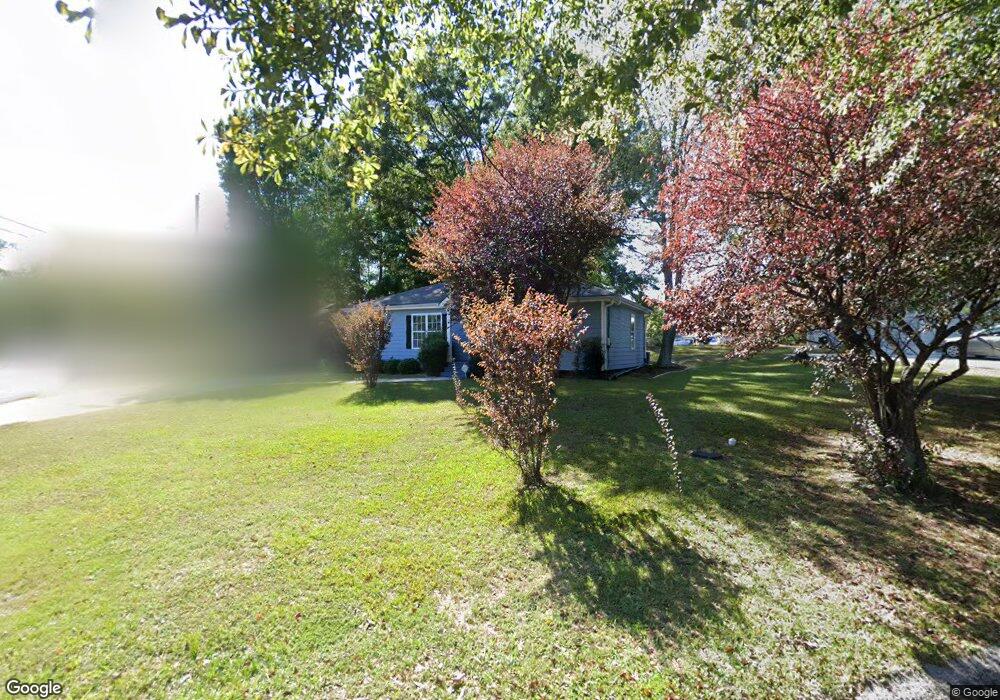
600 Tom Read Dr Marietta, GA 30062
Eastern Marietta NeighborhoodEstimated Value: $230,000 - $269,075
2
Beds
1
Bath
1,044
Sq Ft
$238/Sq Ft
Est. Value
About This Home
This home is located at 600 Tom Read Dr, Marietta, GA 30062 and is currently estimated at $248,269, approximately $237 per square foot. 600 Tom Read Dr is a home located in Cobb County with nearby schools including Sawyer Road Elementary School, Marietta Sixth Grade Academy, and Marietta Middle School.
Ownership History
Date
Name
Owned For
Owner Type
Purchase Details
Closed on
May 15, 2015
Sold by
Hipps Joseph E
Bought by
Holiday Cole
Current Estimated Value
Home Financials for this Owner
Home Financials are based on the most recent Mortgage that was taken out on this home.
Original Mortgage
$97,206
Outstanding Balance
$74,172
Interest Rate
3.5%
Mortgage Type
FHA
Estimated Equity
$174,097
Purchase Details
Closed on
Feb 26, 2010
Sold by
Federal Natl Mtg Assn Fnma
Bought by
Hipps Joseph E and Hipps Justin G
Purchase Details
Closed on
Jan 5, 2010
Sold by
Bac Home Loans Servicing Lp
Bought by
Federal Natl Mtg Assn Fnma
Purchase Details
Closed on
Feb 20, 2003
Sold by
Ray Amanda J
Bought by
Webb Jason D
Home Financials for this Owner
Home Financials are based on the most recent Mortgage that was taken out on this home.
Original Mortgage
$77,900
Interest Rate
5.89%
Mortgage Type
New Conventional
Create a Home Valuation Report for This Property
The Home Valuation Report is an in-depth analysis detailing your home's value as well as a comparison with similar homes in the area
Home Values in the Area
Average Home Value in this Area
Purchase History
| Date | Buyer | Sale Price | Title Company |
|---|---|---|---|
| Holiday Cole | $99,000 | -- | |
| Hipps Joseph E | -- | -- | |
| Federal Natl Mtg Assn Fnma | -- | -- | |
| Bac Home Loans Servicing Lp | $59,867 | -- | |
| Webb Jason D | $82,000 | -- |
Source: Public Records
Mortgage History
| Date | Status | Borrower | Loan Amount |
|---|---|---|---|
| Open | Holiday Cole | $97,206 | |
| Previous Owner | Webb Jason D | $77,900 |
Source: Public Records
Tax History Compared to Growth
Tax History
| Year | Tax Paid | Tax Assessment Tax Assessment Total Assessment is a certain percentage of the fair market value that is determined by local assessors to be the total taxable value of land and additions on the property. | Land | Improvement |
|---|---|---|---|---|
| 2025 | $18 | $96,216 | $36,000 | $60,216 |
| 2024 | $18 | $91,216 | $28,000 | $63,216 |
| 2023 | $0 | $91,216 | $28,000 | $63,216 |
| 2022 | $18 | $79,056 | $28,000 | $51,056 |
| 2021 | $26 | $61,612 | $24,000 | $37,612 |
| 2020 | $26 | $59,256 | $16,000 | $43,256 |
| 2019 | $24 | $45,840 | $12,000 | $33,840 |
| 2018 | $25 | $49,416 | $12,000 | $37,416 |
| 2017 | $19 | $36,596 | $12,000 | $24,596 |
| 2016 | $23 | $36,596 | $12,000 | $24,596 |
| 2015 | $91 | $12,164 | $9,264 | $2,900 |
| 2014 | $94 | $12,164 | $0 | $0 |
Source: Public Records
Map
Nearby Homes