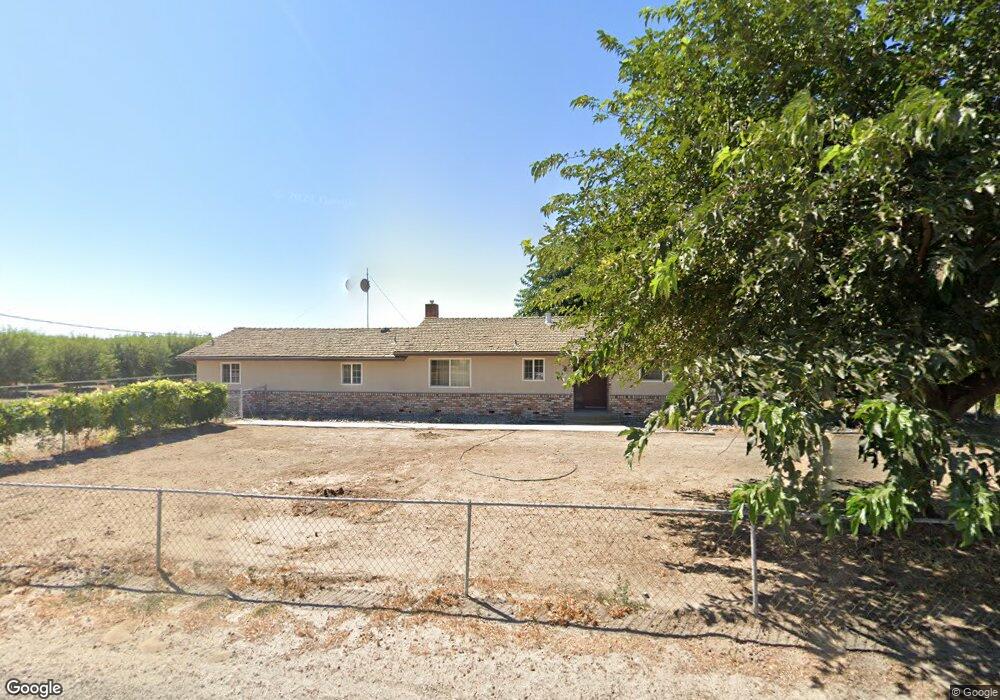
600 W Fulkerth Rd Crows Landing, CA 95313
Estimated Value: $859,000 - $1,261,885
3
Beds
2
Baths
2,126
Sq Ft
$464/Sq Ft
Est. Value
About This Home
This home is located at 600 W Fulkerth Rd, Crows Landing, CA 95313 and is currently estimated at $985,721, approximately $463 per square foot. 600 W Fulkerth Rd is a home located in Stanislaus County with nearby schools including Chatom Elementary School, Mountain View Middle School, and Turlock Junior High School.
Ownership History
Date
Name
Owned For
Owner Type
Purchase Details
Closed on
Sep 8, 2017
Sold by
Alamo Daniel
Bought by
Alamo Farms
Current Estimated Value
Purchase Details
Closed on
Sep 8, 2016
Sold by
Alamo Joseph
Bought by
Alamo Joseph and Alamo Nelia A
Purchase Details
Closed on
Feb 4, 2016
Sold by
Alamo Daniel
Bought by
D & T Alamo 2016 Trust
Purchase Details
Closed on
Oct 7, 2015
Sold by
Alamo Anthony
Bought by
Alamo Anthony and Alamo Karyn M
Purchase Details
Closed on
Feb 6, 2007
Sold by
Soares Cindy D
Bought by
Alamo Anthony and Alamo Karyn
Home Financials for this Owner
Home Financials are based on the most recent Mortgage that was taken out on this home.
Original Mortgage
$500,000
Interest Rate
6.17%
Mortgage Type
Seller Take Back
Purchase Details
Closed on
Aug 22, 1996
Sold by
Green Aaron S
Bought by
Green Cindy D and Burke Curtis
Create a Home Valuation Report for This Property
The Home Valuation Report is an in-depth analysis detailing your home's value as well as a comparison with similar homes in the area
Purchase History
| Date | Buyer | Sale Price | Title Company |
|---|---|---|---|
| Alamo Farms | -- | None Available | |
| Alamo Joseph | -- | None Available | |
| D & T Alamo 2016 Trust | -- | None Available | |
| Alamo Anthony | -- | None Available | |
| Alamo Anthony | $665,000 | Alliance Title Company | |
| Green Cindy D | -- | -- |
Source: Public Records
Mortgage History
| Date | Status | Borrower | Loan Amount |
|---|---|---|---|
| Previous Owner | Alamo Anthony | $500,000 |
Source: Public Records
Tax History
| Year | Tax Paid | Tax Assessment Tax Assessment Total Assessment is a certain percentage of the fair market value that is determined by local assessors to be the total taxable value of land and additions on the property. | Land | Improvement |
|---|---|---|---|---|
| 2025 | $9,574 | $890,949 | $616,298 | $274,651 |
| 2024 | $9,347 | $873,480 | $604,214 | $269,266 |
| 2023 | $9,360 | $856,354 | $592,367 | $263,987 |
| 2022 | $9,229 | $839,563 | $580,752 | $258,811 |
| 2021 | $9,087 | $823,102 | $569,365 | $253,737 |
| 2020 | $8,970 | $814,663 | $563,527 | $251,136 |
| 2019 | $8,832 | $798,690 | $552,478 | $246,212 |
| 2018 | $8,825 | $783,031 | $541,646 | $241,385 |
| 2017 | $8,541 | $767,678 | $531,026 | $236,652 |
| 2016 | $8,244 | $752,626 | $520,614 | $232,012 |
| 2015 | $7,664 | $692,200 | $535,500 | $156,700 |
| 2014 | $6,335 | $570,200 | $397,500 | $172,700 |
Source: Public Records
Map
Nearby Homes
- 1237 W Keyes Rd
- 8631 Mitchell Rd
- 5237 Crows Landing Rd
- 16642 Hickory Ave
- 13807 Carpenter Rd
- 2030 E Grayson Rd Unit 42
- 2030 E Grayson Rd Unit 44
- 2030 E Grayson Rd Unit 26
- 2030 E Grayson Rd Unit 41
- 4449 S Carpenter Rd Unit B12
- 4449 S Carpenter Rd Unit C-1
- 4396 Admiral Ct
- 4376 Admiral Ct
- 1279 Montclaire Dr
- 1613 Fig Ave
- 1440 Don Pedro Rd
- 3816 Teek Ct
- 6630 Foote Rd
- 3816 Dano Ct
- 3608 Cassie Ln
- 773 W Fulkerth Rd
- 800 W Fulkerth Rd
- 601 W Fulkerth Rd
- 813 W Fulkerth Rd
- 912 W Fulkerth Rd
- 406 W Fulkerth Rd
- 431 W Fulkerth Rd
- 1048 W Fulkerth Rd
- 1113 W Fulkerth Rd
- 1101 W Fulkerth Rd
- 9473 Crows Landing Rd
- 9118 Crows Landing Rd
- 9224 Crows Landing Rd
- 1301 W Fulkerth Rd
- 9579 Crows Landing Rd
- 8807 Crows Landing Rd
- 9372 Crows Landing Rd
- 8707 Crows Landing Rd
- 807 W Main Ave
- 8639 Crows Landing Rd
Your Personal Tour Guide
Ask me questions while you tour the home.