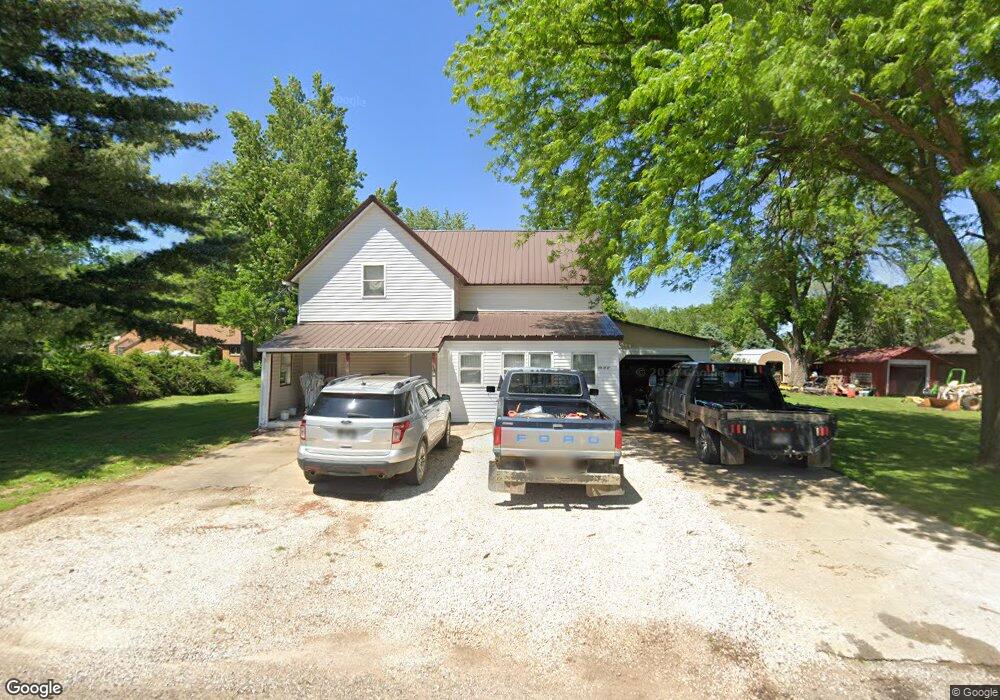
600 Wilkens St Danbury, IA 51019
Estimated Value: $62,121 - $155,000
3
Beds
1
Bath
1,344
Sq Ft
$72/Sq Ft
Est. Value
About This Home
This home is located at 600 Wilkens St, Danbury, IA 51019 and is currently estimated at $96,780, approximately $72 per square foot. 600 Wilkens St is a home located in Woodbury County with nearby schools including Mapleton Elementary School, Mvao Middle School, and Maple Valley-Anthon Oto High School.
Ownership History
Date
Name
Owned For
Owner Type
Purchase Details
Closed on
Jul 24, 2019
Sold by
Bettin Austin and Bettin Steffany J
Bought by
Flannery Christopher D and Hopkins Frankie J
Current Estimated Value
Home Financials for this Owner
Home Financials are based on the most recent Mortgage that was taken out on this home.
Original Mortgage
$22,582
Outstanding Balance
$3,007
Interest Rate
3.73%
Mortgage Type
New Conventional
Estimated Equity
$93,773
Purchase Details
Closed on
May 14, 2012
Sold by
Mohrhauser Brenadine B
Bought by
Swanson Donald D
Create a Home Valuation Report for This Property
The Home Valuation Report is an in-depth analysis detailing your home's value as well as a comparison with similar homes in the area
Home Values in the Area
Average Home Value in this Area
Purchase History
| Date | Buyer | Sale Price | Title Company |
|---|---|---|---|
| Flannery Christopher D | -- | -- | |
| Swanson Donald D | $42,000 | None Available |
Source: Public Records
Mortgage History
| Date | Status | Borrower | Loan Amount |
|---|---|---|---|
| Open | Flannery Christopher D | $22,582 |
Source: Public Records
Tax History Compared to Growth
Tax History
| Year | Tax Paid | Tax Assessment Tax Assessment Total Assessment is a certain percentage of the fair market value that is determined by local assessors to be the total taxable value of land and additions on the property. | Land | Improvement |
|---|---|---|---|---|
| 2025 | $474 | $41,780 | $8,260 | $33,520 |
| 2024 | $474 | $34,750 | $8,260 | $26,490 |
| 2023 | $484 | $34,750 | $8,260 | $26,490 |
| 2022 | $452 | $32,220 | $8,260 | $23,960 |
| 2021 | $452 | $32,220 | $8,260 | $23,960 |
| 2020 | $498 | $32,580 | $8,840 | $23,740 |
| 2019 | $502 | $32,580 | $8,840 | $23,740 |
| 2018 | $492 | $32,580 | $8,840 | $23,740 |
| 2017 | $504 | $32,580 | $8,840 | $23,740 |
| 2016 | $688 | $44,450 | $0 | $0 |
| 2015 | $642 | $41,540 | $8,260 | $33,280 |
| 2014 | $642 | $41,540 | $8,260 | $33,280 |
Source: Public Records
Map
Nearby Homes