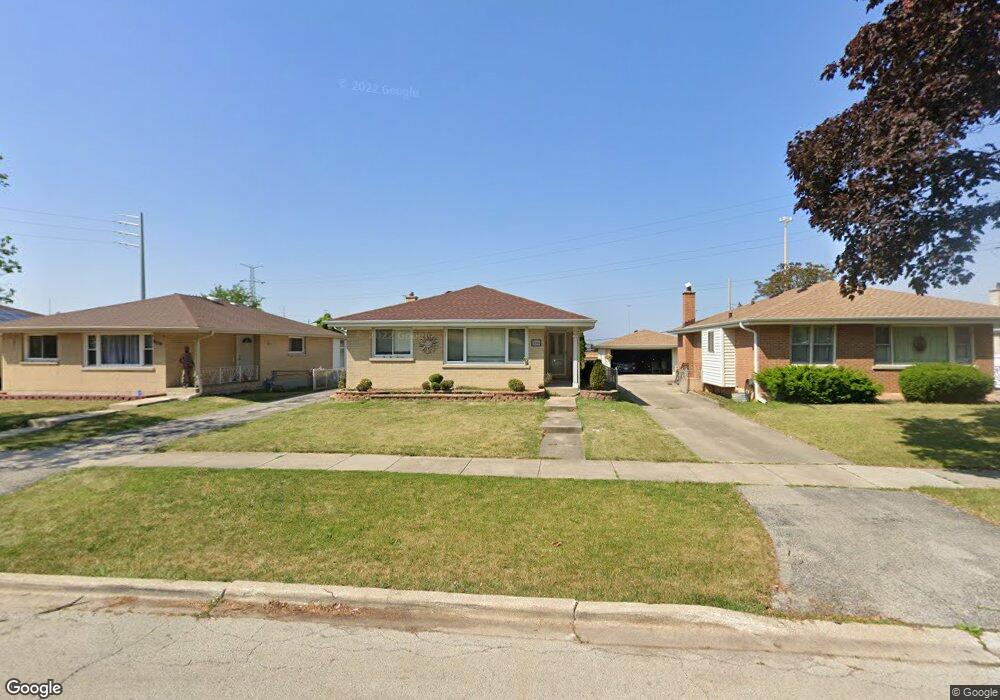
6000 Park Ave Berkeley, IL 60163
Estimated Value: $308,000 - $325,000
3
Beds
1
Bath
1,108
Sq Ft
$285/Sq Ft
Est. Value
About This Home
This home is located at 6000 Park Ave, Berkeley, IL 60163 and is currently estimated at $316,306, approximately $285 per square foot. 6000 Park Ave is a home located in Cook County with nearby schools including Macarthur Intermediate School, Sunnyside Elementary School, and Proviso West High School.
Ownership History
Date
Name
Owned For
Owner Type
Purchase Details
Closed on
Jul 30, 2002
Sold by
Lawson Gary M
Bought by
Sanchez Mauricio
Current Estimated Value
Home Financials for this Owner
Home Financials are based on the most recent Mortgage that was taken out on this home.
Original Mortgage
$152,704
Outstanding Balance
$62,489
Interest Rate
6.63%
Estimated Equity
$253,817
Purchase Details
Closed on
Jul 3, 2002
Sold by
Lawson Deborah A
Bought by
Lawson Gary M
Home Financials for this Owner
Home Financials are based on the most recent Mortgage that was taken out on this home.
Original Mortgage
$152,704
Outstanding Balance
$62,489
Interest Rate
6.63%
Estimated Equity
$253,817
Purchase Details
Closed on
Aug 30, 1993
Sold by
Pettrone Lucille
Bought by
Lawson Gary M and Lawson Deborah A
Home Financials for this Owner
Home Financials are based on the most recent Mortgage that was taken out on this home.
Original Mortgage
$119,583
Interest Rate
7.02%
Mortgage Type
FHA
Create a Home Valuation Report for This Property
The Home Valuation Report is an in-depth analysis detailing your home's value as well as a comparison with similar homes in the area
Home Values in the Area
Average Home Value in this Area
Purchase History
| Date | Buyer | Sale Price | Title Company |
|---|---|---|---|
| Sanchez Mauricio | $191,000 | Preferred Title Ins Agency | |
| Lawson Gary M | -- | Preferred Title Ins Agency | |
| Lawson Gary M | $80,000 | -- |
Source: Public Records
Mortgage History
| Date | Status | Borrower | Loan Amount |
|---|---|---|---|
| Open | Sanchez Mauricio | $152,704 | |
| Previous Owner | Lawson Gary M | $119,583 |
Source: Public Records
Tax History
| Year | Tax Paid | Tax Assessment Tax Assessment Total Assessment is a certain percentage of the fair market value that is determined by local assessors to be the total taxable value of land and additions on the property. | Land | Improvement |
|---|---|---|---|---|
| 2025 | $8,035 | $25,000 | $4,125 | $20,875 |
| 2024 | $8,035 | $25,000 | $4,125 | $20,875 |
| 2023 | $6,793 | $25,000 | $4,125 | $20,875 |
| 2022 | $6,793 | $18,884 | $2,813 | $16,071 |
| 2021 | $6,811 | $18,883 | $2,812 | $16,071 |
| 2020 | $6,517 | $18,883 | $2,812 | $16,071 |
| 2019 | $5,164 | $15,613 | $2,625 | $12,988 |
| 2018 | $5,060 | $15,613 | $2,625 | $12,988 |
| 2017 | $4,861 | $15,613 | $2,625 | $12,988 |
| 2016 | $4,215 | $12,911 | $2,437 | $10,474 |
| 2015 | $4,152 | $12,911 | $2,437 | $10,474 |
| 2014 | $4,099 | $12,911 | $2,437 | $10,474 |
| 2013 | $4,782 | $15,690 | $2,437 | $13,253 |
Source: Public Records
Map
Nearby Homes
- 1038 Arthur Ave
- 450 E Park Ave
- 5920 Chicago Ave
- 444 E Schiller St
- 5809 Huron St
- 130 S Elm Tree Ln
- 5706 Saint Charles Rd
- 5700 Saint Charles Rd
- 1428 1/2 N Ashbel Ave
- 220 N Geneva Ave
- 446 S Stratford Ave
- 324 S Poplar Ave
- 497 S Stratford Ave
- 5936 W Maple Ave
- 515 S Parkview Ave
- 1529 N Hillside Ave
- 377 S Prairie Ave
- 5509 Bohlander Ave
- 110 N Willow Rd
- 153 S Kenmore Ave