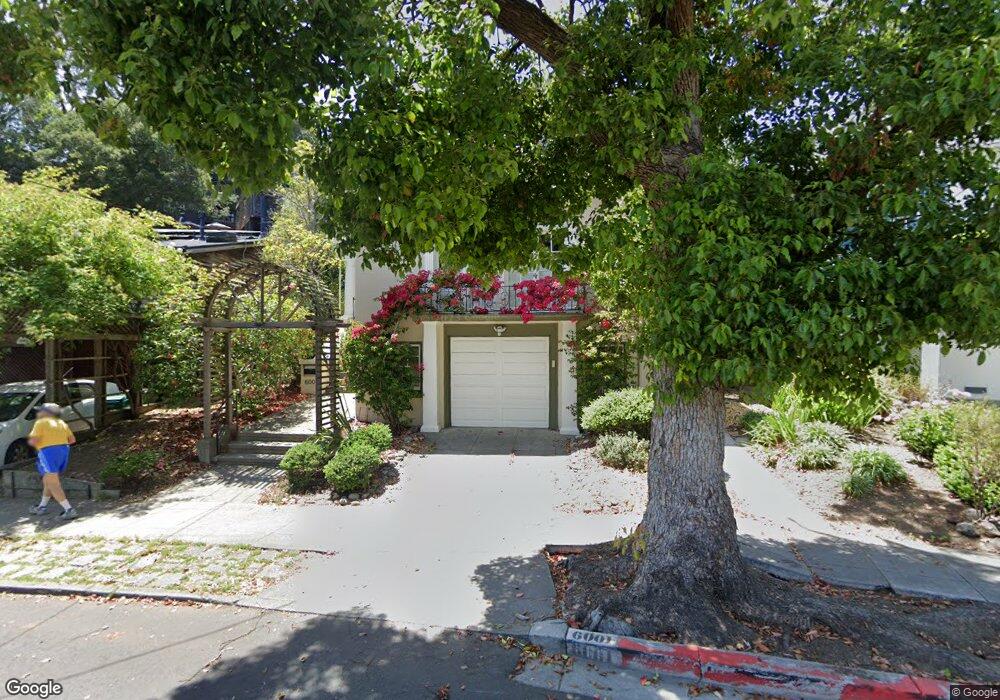
6001 Chabolyn Terrace Oakland, CA 94618
Rockridge NeighborhoodEstimated Value: $1,617,000 - $1,734,459
2
Beds
2
Baths
1,542
Sq Ft
$1,097/Sq Ft
Est. Value
About This Home
This home is located at 6001 Chabolyn Terrace, Oakland, CA 94618 and is currently estimated at $1,692,115, approximately $1,097 per square foot. 6001 Chabolyn Terrace is a home located in Alameda County with nearby schools including John Muir Elementary School, Emerson Elementary School, and Malcolm X Elementary School.
Ownership History
Date
Name
Owned For
Owner Type
Purchase Details
Closed on
Mar 5, 2018
Sold by
Kao James T and Kao Jane C
Bought by
Kao James T and Kao Jane C
Current Estimated Value
Purchase Details
Closed on
Nov 24, 2009
Sold by
Ruebner Anthony S S and Ruebner Anthony S
Bought by
Kao James T and Kao Jane C
Purchase Details
Closed on
Apr 20, 2008
Sold by
Ruebner Anthony Steven
Bought by
Ruebner Anthony S S and Ruebner Anthony S
Purchase Details
Closed on
Mar 10, 2003
Sold by
Ruebner Nina Beth
Bought by
Ruebner Anthony S
Home Financials for this Owner
Home Financials are based on the most recent Mortgage that was taken out on this home.
Original Mortgage
$192,900
Interest Rate
5.83%
Purchase Details
Closed on
Sep 26, 2000
Sold by
Lockie Ronald R and Lockie Helen L
Bought by
Ruebner Anthony S
Home Financials for this Owner
Home Financials are based on the most recent Mortgage that was taken out on this home.
Original Mortgage
$200,000
Interest Rate
7.98%
Create a Home Valuation Report for This Property
The Home Valuation Report is an in-depth analysis detailing your home's value as well as a comparison with similar homes in the area
Home Values in the Area
Average Home Value in this Area
Purchase History
| Date | Buyer | Sale Price | Title Company |
|---|---|---|---|
| Kao James T | -- | None Available | |
| Kao James T | $870,000 | Old Republic Title Company | |
| Ruebner Anthony S S | -- | None Available | |
| Ruebner Anthony S | -- | Fidelity National Title Co | |
| Ruebner Anthony S | $575,000 | Fidelity National Title Co |
Source: Public Records
Mortgage History
| Date | Status | Borrower | Loan Amount |
|---|---|---|---|
| Previous Owner | Ruebner Anthony S | $192,900 | |
| Previous Owner | Ruebner Anthony S | $200,000 | |
| Closed | Ruebner Anthony S | $199,950 |
Source: Public Records
Tax History Compared to Growth
Tax History
| Year | Tax Paid | Tax Assessment Tax Assessment Total Assessment is a certain percentage of the fair market value that is determined by local assessors to be the total taxable value of land and additions on the property. | Land | Improvement |
|---|---|---|---|---|
| 2025 | $17,805 | $1,115,934 | $336,880 | $786,054 |
| 2024 | $17,805 | $1,093,923 | $330,277 | $770,646 |
| 2023 | $17,427 | $1,079,338 | $323,801 | $755,537 |
| 2022 | $17,095 | $1,051,180 | $317,454 | $740,726 |
| 2021 | $17,125 | $1,030,440 | $311,232 | $726,208 |
| 2020 | $16,149 | $1,026,808 | $308,042 | $718,766 |
| 2019 | $15,454 | $1,006,676 | $302,003 | $704,673 |
| 2018 | $15,184 | $986,944 | $296,083 | $690,861 |
| 2017 | $14,665 | $967,595 | $290,278 | $677,317 |
| 2016 | $14,161 | $948,630 | $284,589 | $664,041 |
| 2015 | $13,966 | $934,388 | $280,316 | $654,072 |
| 2014 | $13,805 | $916,091 | $274,827 | $641,264 |
Source: Public Records
Map
Nearby Homes
- 0 Ivanhoe Rd Unit 41053781
- 6218 Manoa St
- 6189 Margarido Dr
- 2964 Magnolia St
- 5936 Broadway
- 309 63rd St
- 2636 Alcatraz Ave
- 6000 N Rockridge Blvd
- 0 Tunnel Rd
- 6108 Hillegass Ave
- 5687 Miles Ave
- 3021 Bateman St
- 14 Contra Costa Place
- 5522 Taft Ave
- 7361 Claremont Ave
- 142 Gravatt Dr
- 484 Forest St
- 5555 Carlton St
- 1522 Grand View Dr
- 2417 Webster St
- 2 Roslyn Ct
- 5995 Chabolyn Terrace
- 14 Roslyn Ct
- 5981 Chabolyn Terrace
- 28 Eucalyptus Rd
- 5979 Chabolyn Terrace
- 5986 Chabolyn Terrace
- 16 Roslyn Ct
- 24 Eucalyptus Rd
- 9 Roslyn Ct
- 6004 Chabolyn Terrace
- 6004 Chabolyn Terrace
- 32 Eucalyptus Rd
- 36 Eucalyptus Rd
- 11 Roslyn Ct
- 5969 Chabolyn Terrace
- 15 Roslyn Ct
- 20 Eucalyptus Rd
- 19 Roslyn Ct
- 6007 Chabolyn Terrace