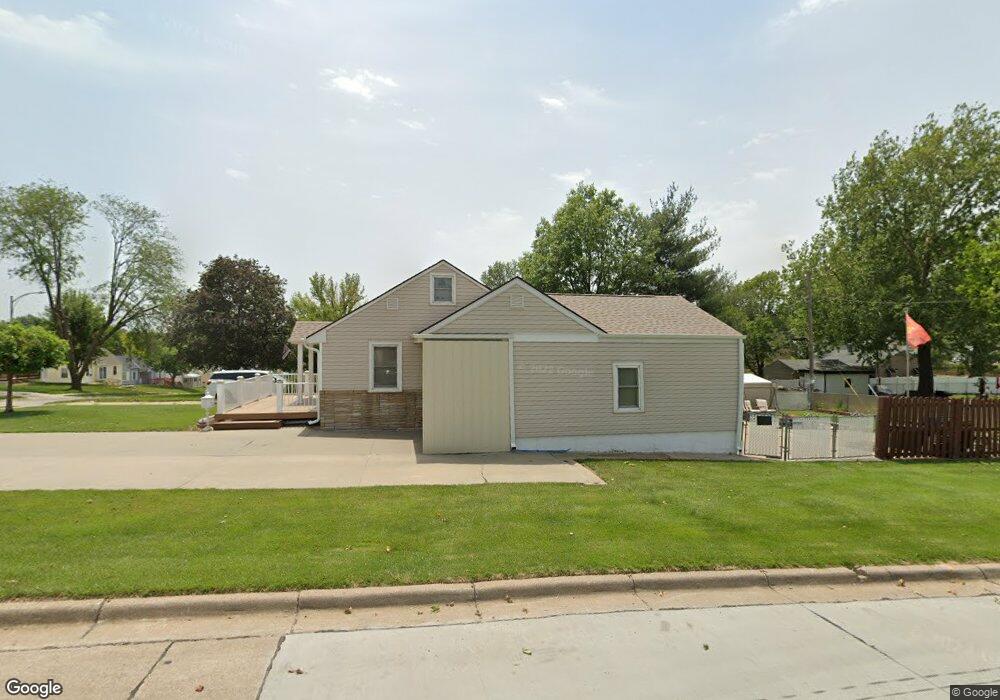
6002 S 41st Ave Omaha, NE 68107
South Central Omaha NeighborhoodEstimated Value: $186,802 - $212,000
2
Beds
1
Bath
864
Sq Ft
$228/Sq Ft
Est. Value
About This Home
This home is located at 6002 S 41st Ave, Omaha, NE 68107 and is currently estimated at $197,201, approximately $228 per square foot. 6002 S 41st Ave is a home located in Douglas County with nearby schools including Gateway Elementary School, Bryan High School, and Sts. Peter and Paul School.
Ownership History
Date
Name
Owned For
Owner Type
Purchase Details
Closed on
Jun 4, 2019
Sold by
Bernady James E and Fox Bernady Ronda J
Bought by
Jackson Todd C and Jackson Marnie J
Current Estimated Value
Home Financials for this Owner
Home Financials are based on the most recent Mortgage that was taken out on this home.
Original Mortgage
$141,000
Outstanding Balance
$123,457
Interest Rate
4.1%
Mortgage Type
Commercial
Estimated Equity
$73,744
Purchase Details
Closed on
Jun 20, 2012
Sold by
Brandel Henrietta C and Brandel Ronald J
Bought by
Bernady James E and Bernady Ronda J
Create a Home Valuation Report for This Property
The Home Valuation Report is an in-depth analysis detailing your home's value as well as a comparison with similar homes in the area
Home Values in the Area
Average Home Value in this Area
Purchase History
| Date | Buyer | Sale Price | Title Company |
|---|---|---|---|
| Jackson Todd C | $141,000 | Ambassador Title Services | |
| Bernady James E | -- | None Available |
Source: Public Records
Mortgage History
| Date | Status | Borrower | Loan Amount |
|---|---|---|---|
| Open | Jackson Todd C | $141,000 |
Source: Public Records
Tax History
| Year | Tax Paid | Tax Assessment Tax Assessment Total Assessment is a certain percentage of the fair market value that is determined by local assessors to be the total taxable value of land and additions on the property. | Land | Improvement |
|---|---|---|---|---|
| 2025 | $2,881 | $176,500 | $12,200 | $164,300 |
| 2024 | $3,534 | $176,500 | $12,200 | $164,300 |
| 2023 | $3,534 | $167,500 | $12,200 | $155,300 |
| 2022 | $2,784 | $130,400 | $10,600 | $119,800 |
| 2021 | $2,760 | $130,400 | $10,600 | $119,800 |
| 2020 | $2,301 | $107,500 | $10,600 | $96,900 |
| 2019 | $2,029 | $94,500 | $10,600 | $83,900 |
| 2018 | $2,032 | $94,500 | $10,600 | $83,900 |
| 2016 | $1,764 | $82,200 | $6,400 | $75,800 |
Source: Public Records
Map
Nearby Homes
Your Personal Tour Guide
Ask me questions while you tour the home.