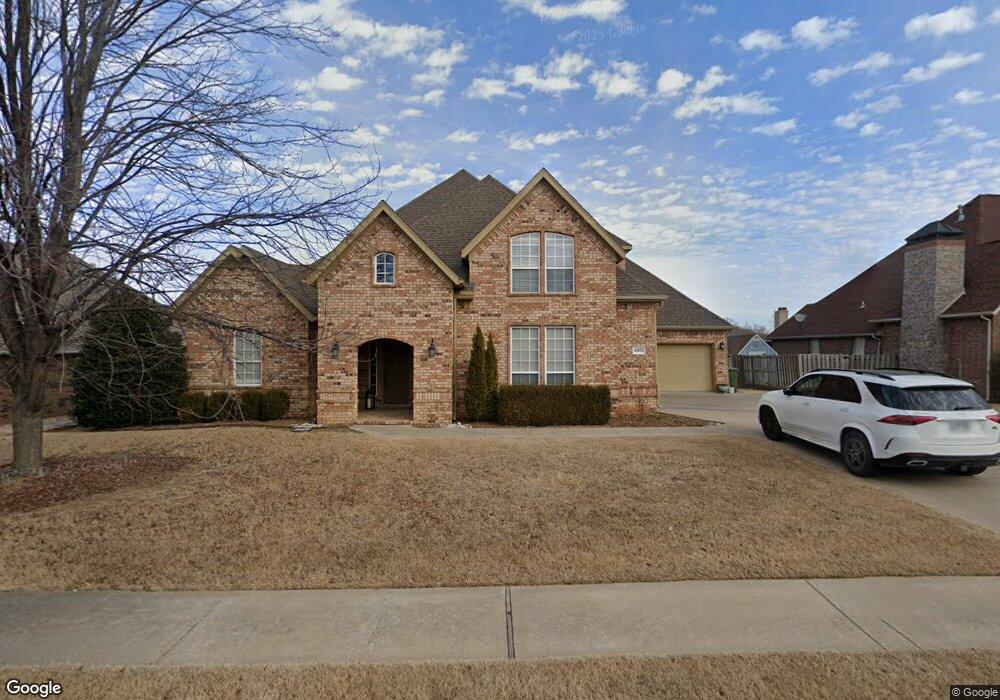
6005 Bainbridge Dr Rogers, AR 72758
Estimated Value: $668,000 - $720,000
--
Bed
4
Baths
3,245
Sq Ft
$215/Sq Ft
Est. Value
About This Home
This home is located at 6005 Bainbridge Dr, Rogers, AR 72758 and is currently estimated at $696,726, approximately $214 per square foot. 6005 Bainbridge Dr is a home located in Benton County with nearby schools including Bright Field Middle School, Fulbright Junior High School, and Bentonville High School.
Ownership History
Date
Name
Owned For
Owner Type
Purchase Details
Closed on
Mar 8, 2019
Sold by
Hoskins Brock E and Hoskins Crystal L
Bought by
Smith Jackson W and Smith Allison
Current Estimated Value
Home Financials for this Owner
Home Financials are based on the most recent Mortgage that was taken out on this home.
Original Mortgage
$261,375
Outstanding Balance
$229,327
Interest Rate
4.4%
Mortgage Type
New Conventional
Estimated Equity
$467,399
Purchase Details
Closed on
Mar 16, 2011
Sold by
Hoskins Brock E and Hoskins Crystal L
Bought by
Hoskins Brock E and Hoskins Crystal L
Purchase Details
Closed on
Jul 27, 2007
Sold by
Liberty Holdings Llc
Bought by
Hoskins Brock E and Hoskins Crystal
Home Financials for this Owner
Home Financials are based on the most recent Mortgage that was taken out on this home.
Original Mortgage
$220,000
Interest Rate
6.69%
Mortgage Type
Purchase Money Mortgage
Create a Home Valuation Report for This Property
The Home Valuation Report is an in-depth analysis detailing your home's value as well as a comparison with similar homes in the area
Home Values in the Area
Average Home Value in this Area
Purchase History
| Date | Buyer | Sale Price | Title Company |
|---|---|---|---|
| Smith Jackson W | $348,500 | Waco Title Company | |
| Hoskins Brock E | -- | None Available | |
| Hoskins Brock E | $380,000 | Elite Title Company Inc |
Source: Public Records
Mortgage History
| Date | Status | Borrower | Loan Amount |
|---|---|---|---|
| Open | Smith Jackson W | $261,375 | |
| Previous Owner | Hoskins Brock E | $220,000 |
Source: Public Records
Tax History Compared to Growth
Tax History
| Year | Tax Paid | Tax Assessment Tax Assessment Total Assessment is a certain percentage of the fair market value that is determined by local assessors to be the total taxable value of land and additions on the property. | Land | Improvement |
|---|---|---|---|---|
| 2025 | $5,190 | $122,476 | $20,000 | $102,476 |
| 2024 | $5,094 | $122,476 | $20,000 | $102,476 |
| 2023 | $4,851 | $79,400 | $15,000 | $64,400 |
| 2022 | $4,476 | $79,400 | $15,000 | $64,400 |
| 2021 | $4,465 | $79,400 | $15,000 | $64,400 |
| 2020 | $4,376 | $77,260 | $8,600 | $68,660 |
| 2019 | $4,376 | $77,260 | $8,600 | $68,660 |
| 2018 | $4,401 | $77,260 | $8,600 | $68,660 |
| 2017 | $4,161 | $77,260 | $8,600 | $68,660 |
| 2016 | $4,161 | $77,260 | $8,600 | $68,660 |
| 2015 | $4,321 | $70,720 | $9,000 | $61,720 |
| 2014 | $3,971 | $70,720 | $9,000 | $61,720 |
Source: Public Records
Map
Nearby Homes
- 6002 Bainbridge Dr
- 6104 Laurel Hill Ln
- 1802 S Liberty Bell Rd
- 6115 W Laurel Hill Ln
- 6108 Pleasant Dr
- 5213 S 60th Place
- 5206 S 60th Place
- 6105 W West Dr
- 4026 West Dr
- 5702 S 59th St
- 6219 W Southgate Ct
- 5705 S 63rd St
- 6503 W Hearth Bay
- 5309 Stone Bay Ct
- 3 S Fiddlesticks Trail
- 5708 S 60th Place
- 5803 S 65th St
- 5813 S 65th St
- 5814 S 65th St
- 5821 S 65th St
- 6005 W Bainbridge Dr
- 6101 W Bainbridge Dr
- 6003 Bainbridge Dr
- 6102 Valley Forge Dr
- 6100 W Valley Forge Dr
- 6104 W Valley Forge Dr
- 6104 Valley Forge Dr
- 6103 W Bainbridge Dr
- 6004 W Bainbridge Dr
- 6100 W Bainbridge Dr
- 6100 Bainbridge Dr
- 6106 W Valley Forge Dr
- 6000 W Bainbridge Dr
- 6105 W Bainbridge Dr
- 6102 W Bainbridge Dr
- 5311 S 60th Place
- 6102 Bainbridge Dr
- 5309 S 60th Place
- 5307 S 60th Place
- 0 Bainbridge Dr Unit 510317