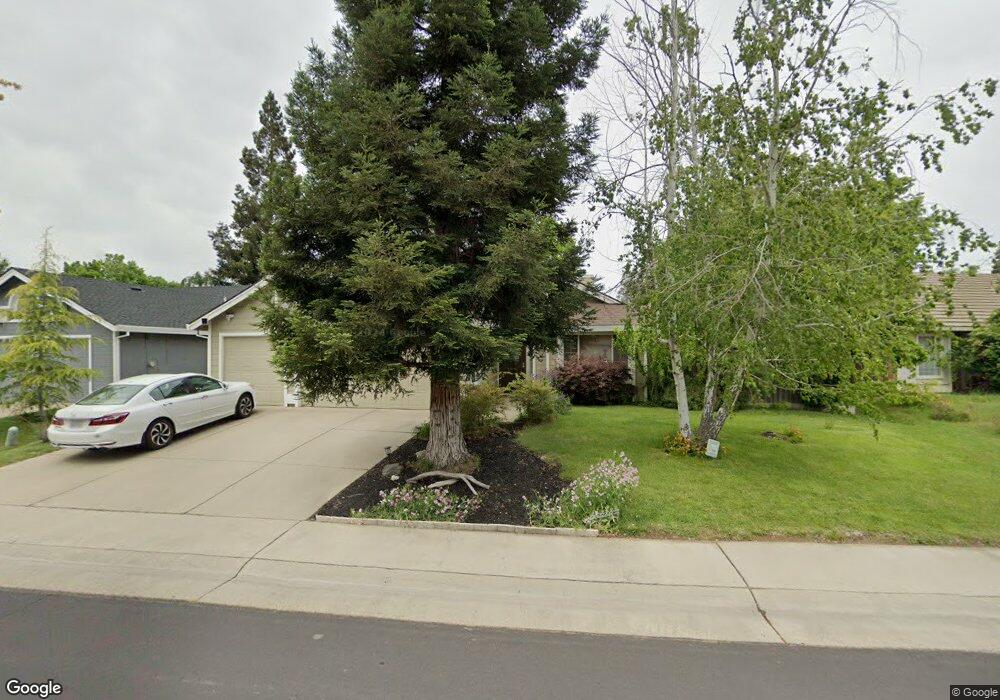
6005 Elk Spring Way Elk Grove, CA 95758
North West Elk Grove NeighborhoodEstimated Value: $526,000 - $583,000
4
Beds
2
Baths
1,728
Sq Ft
$321/Sq Ft
Est. Value
About This Home
This home is located at 6005 Elk Spring Way, Elk Grove, CA 95758 and is currently estimated at $554,928, approximately $321 per square foot. 6005 Elk Spring Way is a home located in Sacramento County with nearby schools including John Ehrhardt Elementary School, Harriet G. Eddy Middle School, and Laguna Creek High School.
Ownership History
Date
Name
Owned For
Owner Type
Purchase Details
Closed on
Aug 14, 2025
Sold by
Edgcombe Stuart John and Edgcombe Pamela Kay
Bought by
Edgcombe Family Trust and Edgcombe
Current Estimated Value
Purchase Details
Closed on
Dec 21, 2005
Sold by
Edgcombe Stuart and Edgcombe Pamela
Bought by
Edgcombe Stuart and Edgcombe Pamela K
Home Financials for this Owner
Home Financials are based on the most recent Mortgage that was taken out on this home.
Original Mortgage
$212,500
Interest Rate
5.87%
Mortgage Type
Purchase Money Mortgage
Purchase Details
Closed on
Aug 23, 2000
Sold by
Knight Family Trust and Orel H
Bought by
Edgcombe Stuart and Edgcombe Pamela
Home Financials for this Owner
Home Financials are based on the most recent Mortgage that was taken out on this home.
Original Mortgage
$175,327
Interest Rate
8.2%
Mortgage Type
FHA
Purchase Details
Closed on
Oct 9, 1997
Sold by
Marie Knight Orel Harvey and Marie Diane
Bought by
Knight Orel H and Knight Diana M
Create a Home Valuation Report for This Property
The Home Valuation Report is an in-depth analysis detailing your home's value as well as a comparison with similar homes in the area
Home Values in the Area
Average Home Value in this Area
Purchase History
| Date | Buyer | Sale Price | Title Company |
|---|---|---|---|
| Edgcombe Family Trust | -- | None Listed On Document | |
| Edgcombe Family Trust | -- | None Listed On Document | |
| Edgcombe Stuart | -- | North American Title Company | |
| Edgcombe Stuart | $176,500 | Alliance Title Company | |
| Knight Orel H | -- | -- |
Source: Public Records
Mortgage History
| Date | Status | Borrower | Loan Amount |
|---|---|---|---|
| Previous Owner | Edgcombe Stuart | $212,500 | |
| Previous Owner | Edgcombe Stuart | $175,327 |
Source: Public Records
Tax History Compared to Growth
Tax History
| Year | Tax Paid | Tax Assessment Tax Assessment Total Assessment is a certain percentage of the fair market value that is determined by local assessors to be the total taxable value of land and additions on the property. | Land | Improvement |
|---|---|---|---|---|
| 2025 | $3,260 | $265,933 | $60,260 | $205,673 |
| 2024 | $3,260 | $260,720 | $59,079 | $201,641 |
| 2023 | $3,169 | $255,609 | $57,921 | $197,688 |
| 2022 | $3,118 | $250,598 | $56,786 | $193,812 |
| 2021 | $3,055 | $245,685 | $55,673 | $190,012 |
| 2020 | $3,010 | $243,167 | $55,103 | $188,064 |
| 2019 | $2,952 | $238,400 | $54,023 | $184,377 |
| 2018 | $2,874 | $233,726 | $52,964 | $180,762 |
| 2017 | $2,818 | $229,144 | $51,926 | $177,218 |
| 2016 | $2,692 | $224,652 | $50,908 | $173,744 |
| 2015 | $2,639 | $221,279 | $50,144 | $171,135 |
| 2014 | $2,605 | $216,945 | $49,162 | $167,783 |
Source: Public Records
Map
Nearby Homes
- 0 Elliott Ranch Rd Unit 225131105
- 6024 Deepdale Way
- 8741 Noble Fir Ln
- 5310 Privet Ln
- 5161 Saint Edwards Way
- 6131 Jacinto Ave
- 6925 Risata Way
- 9105 Turnbull Ct
- 1312 Winterhart St
- 6465 Laguna Mirage Ln
- 5013 Efthemia Way
- 5208 Misty Meadow Way
- 8959 Boreal Way
- Residence 2125 Plan at Tegan Estates
- Residence 1845 Plan at Tegan Estates
- Residence 1960 Plan at Tegan Estates
- Residence 1850 Plan at Tegan Estates
- 8869 Jessup Ct
- 6348 Laguna Mirage Ln
- 9121 Hensley Way
- 5919 Elk Spring Way
- 6013 Elk Spring Way
- 5915 Elk Spring Way
- 5920 Oxford Glen Place
- 6019 Elk Spring Way
- 5925 Oxford Glen Place
- 8912 Meadowspring Dr
- 6006 Elk Spring Way
- 6000 Elk Spring Way
- 6012 Elk Spring Way
- 5918 Elk Spring Way
- 5911 Elk Spring Way
- 8924 Meadowspring Dr
- 5916 Oxford Glen Place
- 8908 Meadowspring Dr
- 5914 Elk Spring Way
- 5921 Oxford Glen Place
- 5907 Elk Spring Way
- 5910 Elk Spring Way
- 8928 Meadowspring Dr