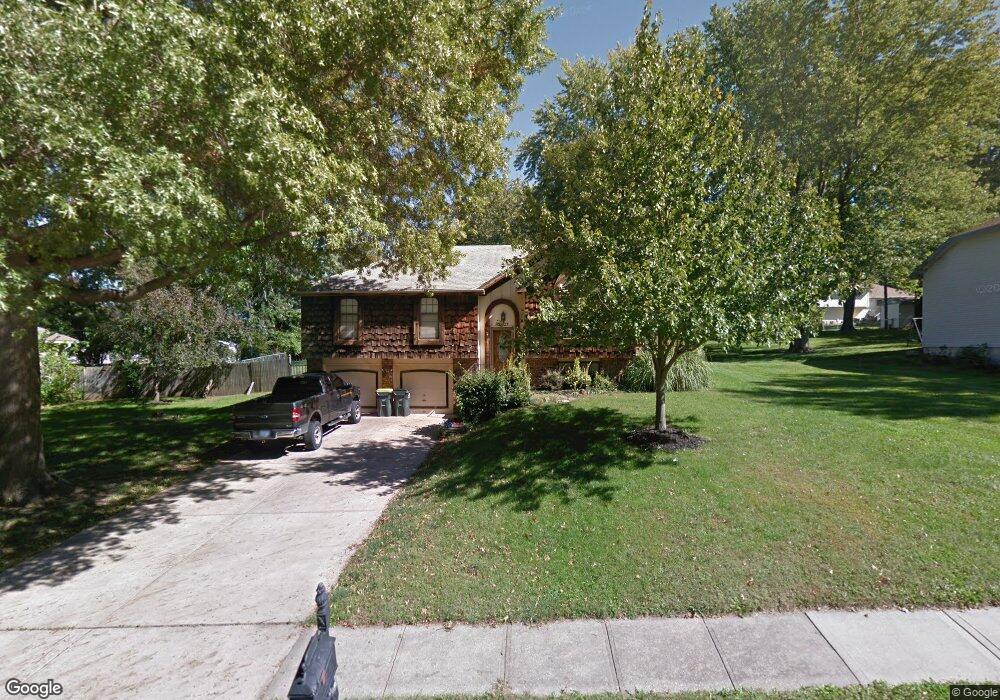
6007 Hauser Dr Shawnee, KS 66216
Estimated Value: $316,800 - $338,000
3
Beds
2
Baths
1,132
Sq Ft
$289/Sq Ft
Est. Value
About This Home
This home is located at 6007 Hauser Dr, Shawnee, KS 66216 and is currently estimated at $326,950, approximately $288 per square foot. 6007 Hauser Dr is a home located in Johnson County with nearby schools including Ray Marsh Elementary School, Trailridge Middle School, and Shawnee Mission Northwest High School.
Ownership History
Date
Name
Owned For
Owner Type
Purchase Details
Closed on
Aug 30, 2024
Sold by
Bennett Kathleen Ann and Breen Kathy A
Bought by
Fuentez Eli and Fuentez Andrea
Current Estimated Value
Home Financials for this Owner
Home Financials are based on the most recent Mortgage that was taken out on this home.
Original Mortgage
$210,622
Outstanding Balance
$207,808
Interest Rate
6.78%
Mortgage Type
FHA
Estimated Equity
$119,142
Purchase Details
Closed on
Jul 2, 2021
Sold by
Bennett Kathaleen A and Breen Kathaleen A
Bought by
Breen Kathy A
Home Financials for this Owner
Home Financials are based on the most recent Mortgage that was taken out on this home.
Original Mortgage
$153,000
Interest Rate
2.9%
Mortgage Type
New Conventional
Purchase Details
Closed on
Sep 2, 2010
Sold by
Breen Jeffrey A
Bought by
Breen Kathaleen A
Create a Home Valuation Report for This Property
The Home Valuation Report is an in-depth analysis detailing your home's value as well as a comparison with similar homes in the area
Home Values in the Area
Average Home Value in this Area
Purchase History
| Date | Buyer | Sale Price | Title Company |
|---|---|---|---|
| Fuentez Eli | -- | Chicago Title Company | |
| Breen Kathy A | -- | None Available | |
| Breen Kathaleen A | -- | None Available |
Source: Public Records
Mortgage History
| Date | Status | Borrower | Loan Amount |
|---|---|---|---|
| Open | Fuentez Eli | $210,622 | |
| Previous Owner | Breen Kathy A | $153,000 |
Source: Public Records
Tax History
| Year | Tax Paid | Tax Assessment Tax Assessment Total Assessment is a certain percentage of the fair market value that is determined by local assessors to be the total taxable value of land and additions on the property. | Land | Improvement |
|---|---|---|---|---|
| 2025 | $3,197 | $31,119 | $7,483 | $23,636 |
| 2024 | $3,197 | $30,441 | $6,808 | $23,633 |
| 2023 | $3,073 | $28,716 | $6,477 | $22,239 |
| 2022 | $2,785 | $25,933 | $5,886 | $20,047 |
| 2021 | $2,638 | $22,942 | $5,354 | $17,588 |
| 2020 | $2,687 | $23,069 | $4,866 | $18,203 |
| 2019 | $2,360 | $20,228 | $4,419 | $15,809 |
| 2018 | $2,340 | $19,975 | $4,419 | $15,556 |
| 2017 | $2,173 | $18,250 | $3,842 | $14,408 |
| 2016 | $2,118 | $17,560 | $3,842 | $13,718 |
| 2015 | $1,958 | $16,939 | $3,842 | $13,097 |
| 2013 | -- | $16,111 | $3,842 | $12,269 |
Source: Public Records
Map
Nearby Homes
- 6018 W Richards Dr
- 6010 E Richards Dr
- 6127, 6129 and lot Pflumm Rd
- 13567 W 58th Terrace
- 5828 Park Cir
- 6143 Park St
- 6145 Park St
- 13800 W 58th Terrace
- 5703 Cottonwood St
- 5735 Cottonwood St
- 6201 Hallet St
- 6525 Pflumm Rd
- 12027 W 58th Place Unit B
- 6009 Earnshaw St
- 14208 W 63rd St
- 5419 Summit Ct
- 6114 Greenwood St
- 13415 W 66th Terrace
- 6524 Westgate Cir
- 6512 Widmer Rd
- 6015 Hauser Dr
- 6001 Hauser Dr
- 6008 Noland Rd
- 6004 Noland Rd
- 6012 Noland Rd
- 6008 Hauser Dr
- 6000 Noland Rd
- 5919 Hauser Dr
- 6019 Hauser Dr
- 6000 Hauser Dr
- 6016 Noland Rd
- 5920 Noland Rd
- 13301 W 59th Terrace
- 6020 Hauser Dr
- 6020 Noland Rd
- 5917 Hauser Dr
- 6023 Hauser Dr
- 6001 Haskins St
- 6007 Noland Rd
- 6003 Noland Rd
Your Personal Tour Guide
Ask me questions while you tour the home.