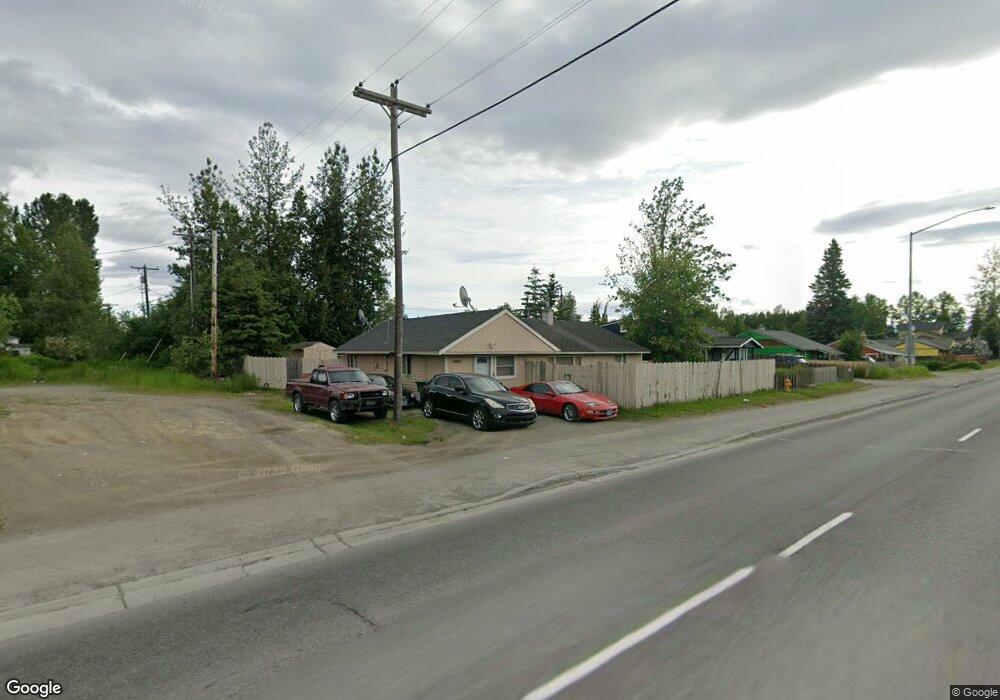
6008 Debarr Rd Anchorage, AK 99504
Northeast Anchorage NeighborhoodEstimated Value: $160,000 - $367,000
3
Beds
2
Baths
1,352
Sq Ft
$208/Sq Ft
Est. Value
About This Home
This home is located at 6008 Debarr Rd, Anchorage, AK 99504 and is currently estimated at $281,507, approximately $208 per square foot. 6008 Debarr Rd is a home located in Anchorage Municipality with nearby schools including Nunaka Valley Elementary School, Clark Middle School, and Bartlett High School.
Ownership History
Date
Name
Owned For
Owner Type
Purchase Details
Closed on
Sep 29, 2008
Sold by
Hood Alan B and Hood Kelli A
Bought by
Frye Stephan A
Current Estimated Value
Home Financials for this Owner
Home Financials are based on the most recent Mortgage that was taken out on this home.
Original Mortgage
$185,621
Outstanding Balance
$123,789
Interest Rate
6.49%
Mortgage Type
FHA
Estimated Equity
$157,718
Purchase Details
Closed on
Feb 29, 2008
Sold by
Hood Alan B and Hood Kelli A
Bought by
Hood Alan B and Hood Kelli A
Home Financials for this Owner
Home Financials are based on the most recent Mortgage that was taken out on this home.
Original Mortgage
$54,000
Interest Rate
5.41%
Mortgage Type
New Conventional
Purchase Details
Closed on
Jun 21, 2006
Sold by
Burke Kerri Maurenn and Burke Alana Siobhan
Bought by
Hood Kelli Ann
Purchase Details
Closed on
Jun 14, 2006
Sold by
Estate Of Michael John Burke and Petruska Terry
Bought by
Hood Kelli Ann and Burke Kerri Maureen
Create a Home Valuation Report for This Property
The Home Valuation Report is an in-depth analysis detailing your home's value as well as a comparison with similar homes in the area
Home Values in the Area
Average Home Value in this Area
Purchase History
| Date | Buyer | Sale Price | Title Company |
|---|---|---|---|
| Frye Stephan A | -- | United Title | |
| Hood Alan B | -- | United Title Guaranty Agency | |
| Hood Kelli Ann | -- | None Available | |
| Hood Kelli Ann | -- | United Title |
Source: Public Records
Mortgage History
| Date | Status | Borrower | Loan Amount |
|---|---|---|---|
| Open | Frye Stephan A | $185,621 | |
| Previous Owner | Hood Alan B | $54,000 |
Source: Public Records
Tax History
| Year | Tax Paid | Tax Assessment Tax Assessment Total Assessment is a certain percentage of the fair market value that is determined by local assessors to be the total taxable value of land and additions on the property. | Land | Improvement |
|---|---|---|---|---|
| 2025 | $2,861 | $274,800 | $74,900 | $199,900 |
| 2024 | $2,861 | $252,200 | $74,900 | $177,300 |
| 2023 | $3,895 | $228,700 | $74,900 | $153,800 |
| 2022 | $3,267 | $242,500 | $75,000 | $167,500 |
| 2021 | $3,891 | $215,900 | $75,000 | $140,900 |
| 2020 | $2,856 | $210,300 | $75,000 | $135,300 |
| 2019 | $2,742 | $209,500 | $75,000 | $134,500 |
| 2018 | $2,781 | $212,000 | $75,000 | $137,000 |
| 2017 | $3,124 | $219,500 | $75,000 | $144,500 |
| 2016 | $2,955 | $216,400 | $65,100 | $151,300 |
| 2015 | $2,955 | $220,300 | $65,100 | $155,200 |
| 2014 | $2,955 | $210,400 | $62,900 | $147,500 |
Source: Public Records
Map
Nearby Homes
- 6109 Debarr Rd Unit 210
- 1265 Norman St Unit 18
- 6038 E 12th Ave
- 6110 E 12th Ave Unit 3B
- 1506 Atkinson Dr
- 1507 Elmendorf Dr
- 1415 Twining Dr
- 1101 Bentree Cir
- 6229 Winding Way Unit 6
- 6030 Staedem Dr
- Tr E Debarr Rd
- 6600 Donna Dr
- 1500 Marten St
- 1120 Ermine St
- 420 Peppertree Loop
- 501 San Juan Cir
- 5574 Sapphire Loop Unit 53B
- 6216 Prosperity Dr Unit 105
- 5717 Sapphire Loop Unit 31A
- 560 Izembek Cir
- 6006 Debarr Rd
- 6005 Buckner Dr
- 6004 Debarr Rd
- 1300 Atkinson Dr
- 1302 Atkinson Dr
- 6003 Buckner Dr
- 1304 Atkinson Dr
- 6007 Buckner Dr
- 6002 Debarr Rd
- 1306 Atkinson Dr
- 6001 Buckner Dr
- 1308 Atkinson Dr
- 1401 Elmendorf Dr
- 1301 Nunaka Dr
- 1303 Nunaka Dr
- 1303 Atkinson Dr
- 1400 Atkinson Dr
- 1305 Nunaka Dr
- 6004 Buckner Dr
- 1403 Elmendorf Dr
Your Personal Tour Guide
Ask me questions while you tour the home.