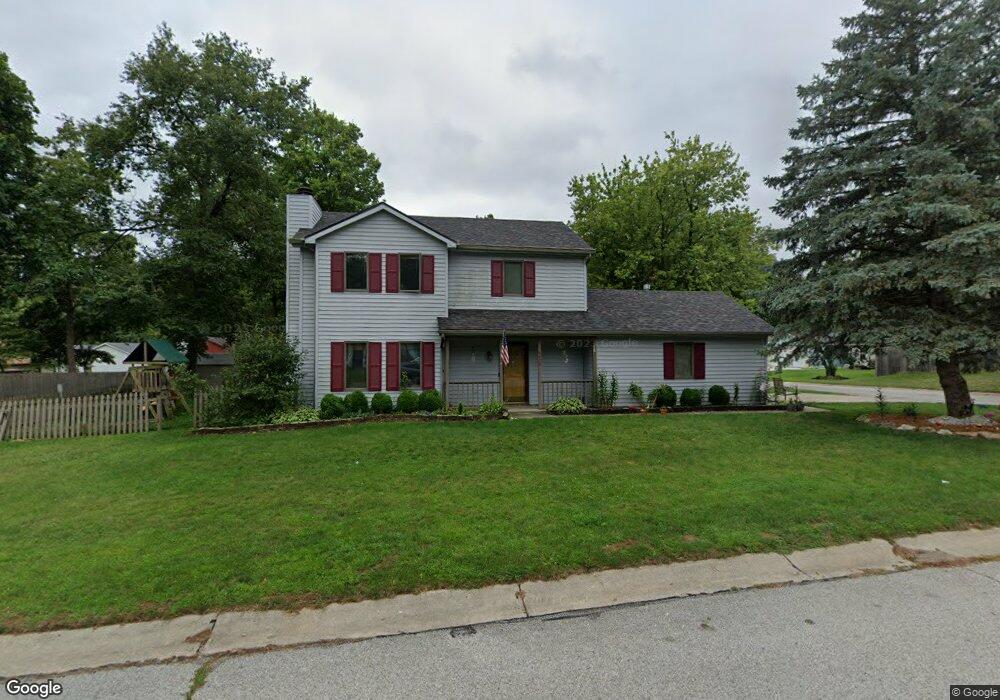
6008 Horseshoe Bend Fort Wayne, IN 46825
Northeast Fort Wayne NeighborhoodEstimated Value: $238,000 - $257,520
3
Beds
3
Baths
1,500
Sq Ft
$168/Sq Ft
Est. Value
About This Home
This home is located at 6008 Horseshoe Bend, Fort Wayne, IN 46825 and is currently estimated at $251,630, approximately $167 per square foot. 6008 Horseshoe Bend is a home located in Allen County with nearby schools including Willard Shambaugh Elementary School, Jefferson Middle School, and Northrop High School.
Ownership History
Date
Name
Owned For
Owner Type
Purchase Details
Closed on
Jun 13, 2008
Sold by
David Kevin P
Bought by
Ramsey Wesley R and Brannon Abigail J
Current Estimated Value
Home Financials for this Owner
Home Financials are based on the most recent Mortgage that was taken out on this home.
Original Mortgage
$105,346
Outstanding Balance
$67,566
Interest Rate
6.04%
Mortgage Type
FHA
Estimated Equity
$184,064
Purchase Details
Closed on
May 4, 2004
Sold by
Flack Tanya J
Bought by
David Kevin P
Home Financials for this Owner
Home Financials are based on the most recent Mortgage that was taken out on this home.
Original Mortgage
$77,200
Interest Rate
5.63%
Mortgage Type
Purchase Money Mortgage
Purchase Details
Closed on
May 9, 2003
Sold by
Lentner Nathan A and Lentner Alicia J
Bought by
David Kevin P and Flack Tanya J
Home Financials for this Owner
Home Financials are based on the most recent Mortgage that was taken out on this home.
Original Mortgage
$76,720
Interest Rate
6.02%
Create a Home Valuation Report for This Property
The Home Valuation Report is an in-depth analysis detailing your home's value as well as a comparison with similar homes in the area
Home Values in the Area
Average Home Value in this Area
Purchase History
| Date | Buyer | Sale Price | Title Company |
|---|---|---|---|
| Ramsey Wesley R | -- | Riverbend Title | |
| David Kevin P | -- | Commonwealth-Dreibelbiss Tit | |
| David Kevin P | -- | -- |
Source: Public Records
Mortgage History
| Date | Status | Borrower | Loan Amount |
|---|---|---|---|
| Open | Ramsey Wesley R | $105,346 | |
| Previous Owner | David Kevin P | $77,200 | |
| Previous Owner | David Kevin P | $76,720 | |
| Closed | David Kevin P | $14,000 |
Source: Public Records
Tax History Compared to Growth
Tax History
| Year | Tax Paid | Tax Assessment Tax Assessment Total Assessment is a certain percentage of the fair market value that is determined by local assessors to be the total taxable value of land and additions on the property. | Land | Improvement |
|---|---|---|---|---|
| 2024 | $1,552 | $241,900 | $28,000 | $213,900 |
| 2022 | $1,343 | $197,000 | $28,000 | $169,000 |
| 2021 | $1,122 | $165,300 | $17,200 | $148,100 |
| 2020 | $1,068 | $154,800 | $17,200 | $137,600 |
| 2019 | $980 | $142,400 | $17,200 | $125,200 |
| 2018 | $808 | $124,600 | $17,200 | $107,400 |
| 2017 | $682 | $111,900 | $17,200 | $94,700 |
| 2016 | $673 | $110,000 | $17,200 | $92,800 |
| 2014 | $578 | $102,100 | $17,200 | $84,900 |
| 2013 | $552 | $100,400 | $17,200 | $83,200 |
Source: Public Records
Map
Nearby Homes
- 5932 Horseshoe Bend
- 9826 Tumbleweed Blvd
- 5800-5900 Palo Verde Ct
- 5620 Arapaho Trail
- 6627 Oxbow Ln
- 10725 Trade Wind Ct
- 10423 Willow Creek Dr
- 6720 Hunters Glen Dr
- 6730 Goldenrod Place
- 11031 Eagle River Run
- 10312 Old Woods Rd Unit LOT 10
- 9520 Woodsmill Run
- 6832 Jerome Park Place
- 8549 Artemis Ln
- 6848 Jerome Park Place
- 6864 Jerome Park Place
- 6880 Jerome Park Place
- 11034 Old Oak Trail
- 6937 Jerome Park Place
- 6896 Jerome Park Place
- 9926 Mustang Dr
- 6026 Horseshoe Bend
- 6013 Horseshoe Bend
- 9925 Spur Creek Ct
- 9914 Mustang Dr
- 6003 Horseshoe Bend
- 9923 Mustang Dr
- 6027 Horseshoe Bend
- 9915 Spur Creek Ct
- 5935 Horseshoe Bend
- 9917 Mustang Dr
- 9910 Mustang Dr
- 10019 Spur Creek Ct
- 5928 Horseshoe Bend
- 6104 Sundance Dr
- 9907 Spur Creek Ct
- 5931 Horseshoe Bend
- 9928 Spur Creek Ct
- 9905 Mustang Dr
- 9936 Spur Creek Ct