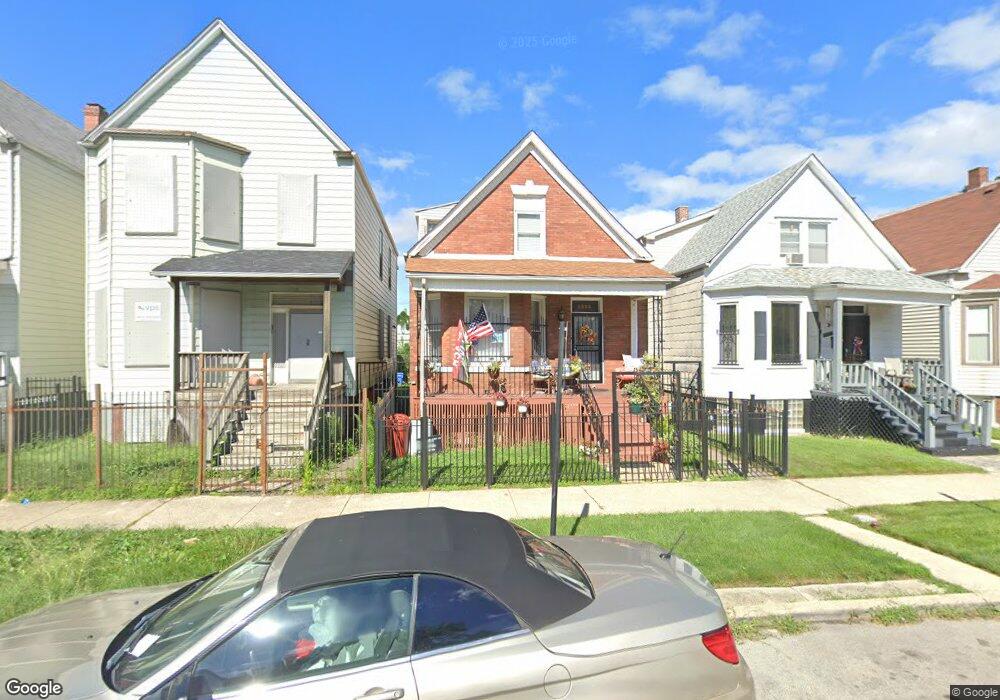
6008 S Bishop St Chicago, IL 60636
Englewood NeighborhoodEstimated Value: $87,267 - $151,000
4
Beds
2
Baths
993
Sq Ft
$128/Sq Ft
Est. Value
About This Home
This home is located at 6008 S Bishop St, Chicago, IL 60636 and is currently estimated at $127,067, approximately $127 per square foot. 6008 S Bishop St is a home located in Cook County with nearby schools including A. Langford Elementary School, Providence-Englewood Elementary Charter School, and Academy of St. Benedict the African.
Ownership History
Date
Name
Owned For
Owner Type
Purchase Details
Closed on
Dec 19, 2023
Sold by
Potts Bernadette
Bought by
B Potts Revocable Living Trust
Current Estimated Value
Purchase Details
Closed on
Nov 25, 2016
Sold by
County Of Cook
Bought by
Potts Bernadette
Purchase Details
Closed on
Jun 8, 2012
Sold by
Federal Home Loan Mortgage Corporation
Bought by
Potts Bernadette
Purchase Details
Closed on
Mar 28, 2012
Sold by
Lloyd Thelma L
Bought by
Federal Home Loan Mortgage Corporation
Purchase Details
Closed on
Oct 15, 2007
Sold by
Mboya Sharif Terence and Mboya Sharif
Bought by
Lloyd Thelma
Purchase Details
Closed on
Apr 24, 2006
Sold by
Lloyd Thelma
Bought by
Lloyd Thelma and Sharif Terence
Purchase Details
Closed on
Jul 27, 2001
Sold by
Nevilles Alberta
Bought by
Lloyd Thelma
Home Financials for this Owner
Home Financials are based on the most recent Mortgage that was taken out on this home.
Original Mortgage
$62,026
Interest Rate
7.15%
Mortgage Type
FHA
Create a Home Valuation Report for This Property
The Home Valuation Report is an in-depth analysis detailing your home's value as well as a comparison with similar homes in the area
Home Values in the Area
Average Home Value in this Area
Purchase History
| Date | Buyer | Sale Price | Title Company |
|---|---|---|---|
| B Potts Revocable Living Trust | -- | None Listed On Document | |
| Potts Bernadette | -- | Attorney | |
| Potts Bernadette | $15,000 | Attorneys Title Guaranty Fun | |
| Federal Home Loan Mortgage Corporation | -- | None Available | |
| Lloyd Thelma | -- | None Available | |
| Lloyd Thelma | -- | None Available | |
| Lloyd Thelma | $63,000 | -- |
Source: Public Records
Mortgage History
| Date | Status | Borrower | Loan Amount |
|---|---|---|---|
| Previous Owner | Lloyd Thelma | $62,026 |
Source: Public Records
Tax History
| Year | Tax Paid | Tax Assessment Tax Assessment Total Assessment is a certain percentage of the fair market value that is determined by local assessors to be the total taxable value of land and additions on the property. | Land | Improvement |
|---|---|---|---|---|
| 2025 | -- | $4,400 | $1,050 | $3,350 |
| 2024 | -- | $4,400 | $1,050 | $3,350 |
| 2023 | -- | $2,604 | $1,750 | $854 |
| 2022 | $0 | $2,604 | $1,750 | $854 |
| 2021 | $573 | $2,603 | $1,750 | $853 |
| 2020 | $573 | $5,676 | $2,625 | $3,051 |
| 2019 | $578 | $6,307 | $2,625 | $3,682 |
| 2018 | $567 | $6,307 | $2,625 | $3,682 |
| 2017 | $1,580 | $10,716 | $2,275 | $8,441 |
| 2016 | $1,790 | $11,436 | $2,275 | $9,161 |
| 2015 | $1,615 | $11,436 | $2,275 | $9,161 |
| 2014 | $1,384 | $10,028 | $2,100 | $7,928 |
| 2013 | $1,346 | $10,028 | $2,100 | $7,928 |
Source: Public Records
Map
Nearby Homes
- 5939 S Loomis Blvd
- 5900 S Loomis Blvd
- 6027 S Loomis Blvd
- 5939 S Ada St
- 6101 S Ashland Ave
- 5750 S Bishop St
- 5749 S Bishop St
- 6042 S Marshfield Ave
- 6202 S Bishop St
- 5951 S Elizabeth St
- 6209 S Justine St
- 1215 W 59th St
- 5940 S Racine Ave
- 6229 S Bishop St
- 6119 S Paulina St
- 5711 S Laflin St
- 5734 S Ashland Ave
- 5935 S Racine Ave
- 6037 S Racine Ave
- 5742 S Marshfield Ave
- 6006 S Bishop St
- 6012 S Bishop St
- 6004 S Bishop St
- 6014 S Bishop St
- 6018 S Bishop St
- 6000 S Bishop St
- 6000 S Bishop St Unit 2
- 6000 S Bishop St
- 6000 S Bishop St
- 6020 S Bishop St
- 6024 S Bishop St
- 6009 S Laflin St
- 6007 S Laflin St
- 6013 S Laflin St
- 6017 S Laflin St
- 6019 S Laflin St
- 6001 S Laflin St
- 6026 S Bishop St
- 5958 S Bishop St
- 6021 S Laflin St
Your Personal Tour Guide
Ask me questions while you tour the home.