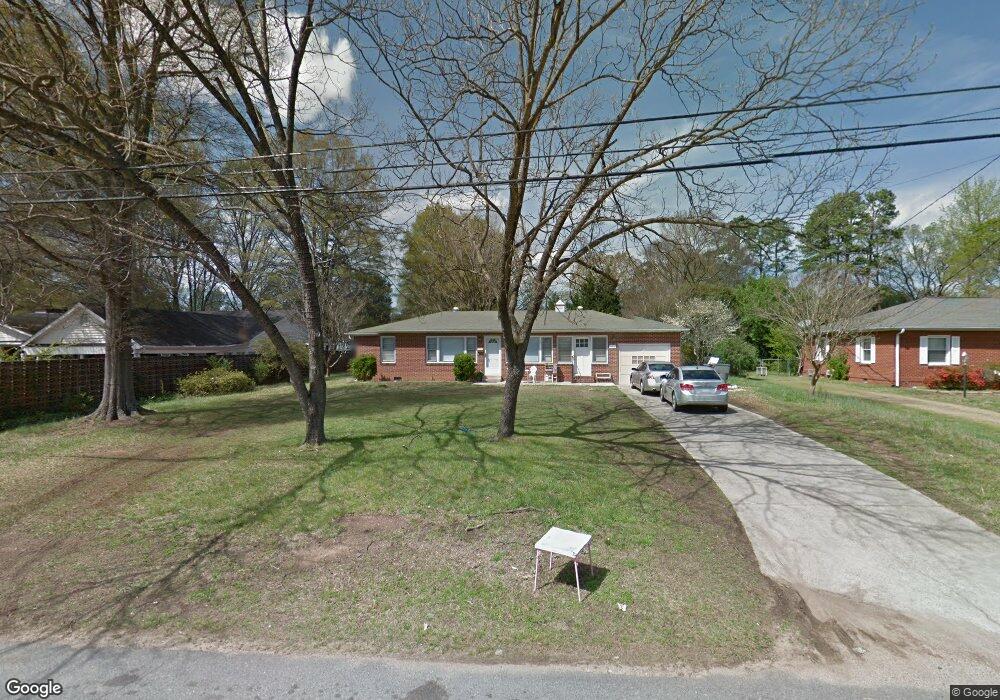
601 Dakota St Unit 20-23 Kannapolis, NC 28083
Estimated Value: $204,000 - $269,000
2
Beds
1
Bath
1,435
Sq Ft
$172/Sq Ft
Est. Value
About This Home
This home is located at 601 Dakota St Unit 20-23, Kannapolis, NC 28083 and is currently estimated at $246,103, approximately $171 per square foot. 601 Dakota St Unit 20-23 is a home located in Cabarrus County with nearby schools including Forest Park Elementary School, Kannapolis Middle, and A.L. Brown High School.
Ownership History
Date
Name
Owned For
Owner Type
Purchase Details
Closed on
Jun 27, 2016
Sold by
Robert Bonnie Francis
Bought by
Quintero Crespo Jesus Porto and Quintero Portla Vivian
Current Estimated Value
Home Financials for this Owner
Home Financials are based on the most recent Mortgage that was taken out on this home.
Original Mortgage
$85,500
Outstanding Balance
$68,430
Interest Rate
3.66%
Mortgage Type
New Conventional
Estimated Equity
$177,673
Purchase Details
Closed on
Jul 23, 2014
Sold by
Greene Ronald D and Greene Joyce N
Bought by
Robert Bonnie Francis
Home Financials for this Owner
Home Financials are based on the most recent Mortgage that was taken out on this home.
Original Mortgage
$72,168
Interest Rate
4.4%
Mortgage Type
FHA
Purchase Details
Closed on
Sep 28, 1999
Sold by
Greene Dewitt Eugene and Greene Ruby C
Bought by
Greene Ronald D
Purchase Details
Closed on
Nov 1, 1954
Create a Home Valuation Report for This Property
The Home Valuation Report is an in-depth analysis detailing your home's value as well as a comparison with similar homes in the area
Home Values in the Area
Average Home Value in this Area
Purchase History
| Date | Buyer | Sale Price | Title Company |
|---|---|---|---|
| Quintero Crespo Jesus Porto | $90,000 | None Available | |
| Robert Bonnie Francis | $73,500 | None Available | |
| Greene Ronald D | -- | -- | |
| -- | -- | -- |
Source: Public Records
Mortgage History
| Date | Status | Borrower | Loan Amount |
|---|---|---|---|
| Open | Quintero Crespo Jesus Porto | $85,500 | |
| Previous Owner | Robert Bonnie Francis | $72,168 |
Source: Public Records
Tax History Compared to Growth
Tax History
| Year | Tax Paid | Tax Assessment Tax Assessment Total Assessment is a certain percentage of the fair market value that is determined by local assessors to be the total taxable value of land and additions on the property. | Land | Improvement |
|---|---|---|---|---|
| 2025 | $2,354 | $207,330 | $51,000 | $156,330 |
| 2024 | $2,354 | $207,330 | $51,000 | $156,330 |
| 2023 | $1,746 | $127,440 | $33,000 | $94,440 |
| 2022 | $1,746 | $127,440 | $33,000 | $94,440 |
| 2021 | $1,746 | $127,440 | $33,000 | $94,440 |
| 2020 | $1,684 | $122,910 | $33,000 | $89,910 |
| 2019 | $1,211 | $88,430 | $20,000 | $68,430 |
| 2018 | $1,194 | $88,430 | $20,000 | $68,430 |
| 2017 | $1,176 | $88,430 | $20,000 | $68,430 |
| 2016 | $1,176 | $107,780 | $25,000 | $82,780 |
| 2015 | -- | $107,780 | $25,000 | $82,780 |
| 2014 | -- | $107,780 | $25,000 | $82,780 |
Source: Public Records
Map
Nearby Homes
- 614 Breckenridge Rd Unit 17
- 302 Suburban Ave
- 709 Carson Ct
- 303 Odell St
- 617 Peace Haven Rd
- 503 Eddleman Rd
- 1013 Kansas St Unit B
- 1013 Kansas St Unit A
- 2301 S Ridge Ave
- 103 Crescent St
- 1010 Tennessee St
- 1025 Michigan St
- 2116 S Main St
- 103 Carriage House Dr
- 105 Ashmont Dr Unit 1
- 111 Landmark Dr
- 2602 Pennsylvania Ave
- 210 Brook St
- 1010 Kentucky St
- 1365 Eagle Claw Dr
- 601 Dakota St
- 603 Dakota St
- 509 Dakota St
- 512 Kansas St
- 510 Kansas St
- 605 Dakota St
- 507 Dakota St
- 506 Kansas St Unit 42-46
- 514 Kansas St
- 607 Dakota St
- 505 Dakota St
- 516 Kansas St
- 500 Kansas St Unit 42-46
- 609 Dakota St
- 610 Dakota St
- 511 Kansas St
- 404 Dakota St
- 509 Kansas St
- 518 Kansas St
- 505 Kansas St