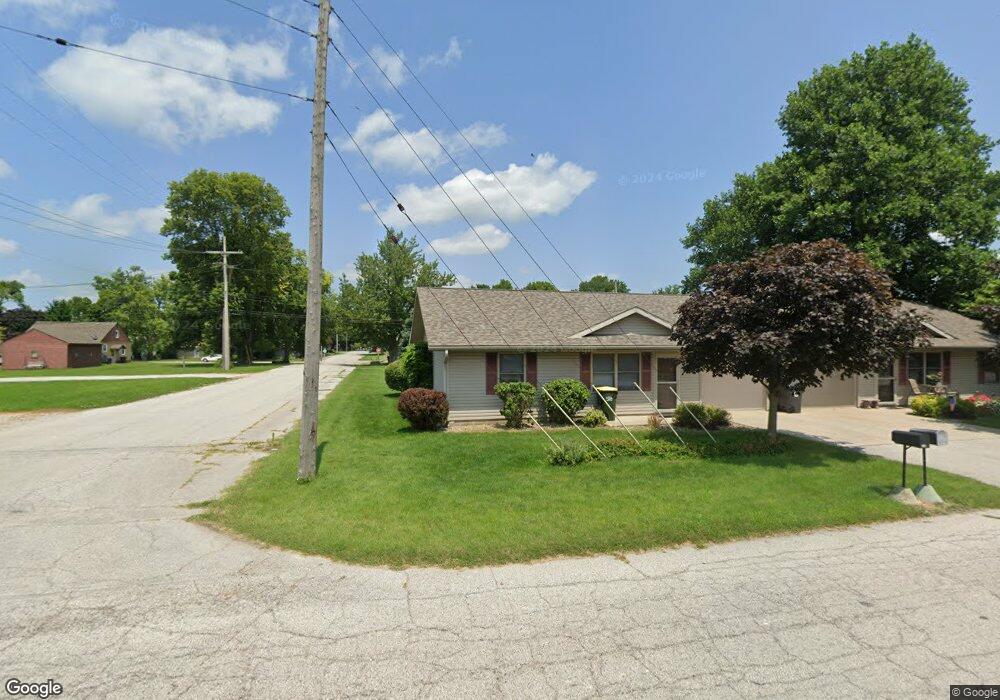
601 E 9th St Fowler, IN 47944
Estimated Value: $196,000 - $224,000
1
Bed
1
Bath
1,015
Sq Ft
$204/Sq Ft
Est. Value
About This Home
This home is located at 601 E 9th St, Fowler, IN 47944 and is currently estimated at $207,000, approximately $203 per square foot. 601 E 9th St is a home located in Benton County with nearby schools including Benton Central Junior/Senior High School and Sacred Heart Elementary School.
Ownership History
Date
Name
Owned For
Owner Type
Purchase Details
Closed on
Aug 10, 2022
Sold by
Dean Alan Burling Revocable Living Trust
Bought by
Gick Family Land Management Llc
Current Estimated Value
Home Financials for this Owner
Home Financials are based on the most recent Mortgage that was taken out on this home.
Original Mortgage
$265,000
Outstanding Balance
$251,623
Interest Rate
5.51%
Mortgage Type
Credit Line Revolving
Estimated Equity
-$44,623
Purchase Details
Closed on
Jul 31, 2000
Sold by
Not Provided
Bought by
Not Provided
Purchase Details
Closed on
Jun 2, 1995
Sold by
Not Provided
Bought by
Not Provided
Create a Home Valuation Report for This Property
The Home Valuation Report is an in-depth analysis detailing your home's value as well as a comparison with similar homes in the area
Purchase History
| Date | Buyer | Sale Price | Title Company |
|---|---|---|---|
| Gick Family Land Management Llc | -- | Ryan Patrick K | |
| Not Provided | $10,000 | -- | |
| Not Provided | $4,500 | -- |
Source: Public Records
Mortgage History
| Date | Status | Borrower | Loan Amount |
|---|---|---|---|
| Open | Gick Family Land Management Llc | $265,000 |
Source: Public Records
Tax History
| Year | Tax Paid | Tax Assessment Tax Assessment Total Assessment is a certain percentage of the fair market value that is determined by local assessors to be the total taxable value of land and additions on the property. | Land | Improvement |
|---|---|---|---|---|
| 2025 | $4,808 | $157,900 | $14,300 | $143,600 |
| 2024 | $4,808 | $211,300 | $14,300 | $197,000 |
| 2023 | $3,266 | $137,500 | $12,500 | $125,000 |
| 2022 | $2,791 | $117,600 | $12,500 | $105,100 |
| 2021 | $2,724 | $113,800 | $12,500 | $101,300 |
| 2020 | $2,383 | $106,600 | $12,500 | $94,100 |
| 2019 | $2,135 | $101,500 | $12,500 | $89,000 |
| 2018 | $2,137 | $101,600 | $12,500 | $89,100 |
| 2017 | $2,139 | $101,600 | $12,500 | $89,100 |
| 2016 | $2,079 | $98,800 | $12,500 | $86,300 |
| 2014 | $2,456 | $116,700 | $11,200 | $105,500 |
| 2013 | $2,456 | $108,500 | $10,600 | $97,900 |
Source: Public Records
Map
Nearby Homes
- 503 E 8th St
- 501 E 7th St
- 902 E 8th St
- 310 E 7th St
- 201 S Grant Ave
- 502 E 5th St
- 909 E 8th St
- 700 S Sharon Ave
- 202 N Van Buren Ave
- 601 E 3rd St
- 303 N Jackson Ave
- 305 N Lincoln Ave
- 1009 E 4th St
- 307 N Madison Ave
- 602 S Park Dr
- 111 W 4th St
- 307 N Washington Ave
- 703 W 2nd St
- Lot 9 W 2nd St
- 665 W 2nd St
Your Personal Tour Guide
Ask me questions while you tour the home.