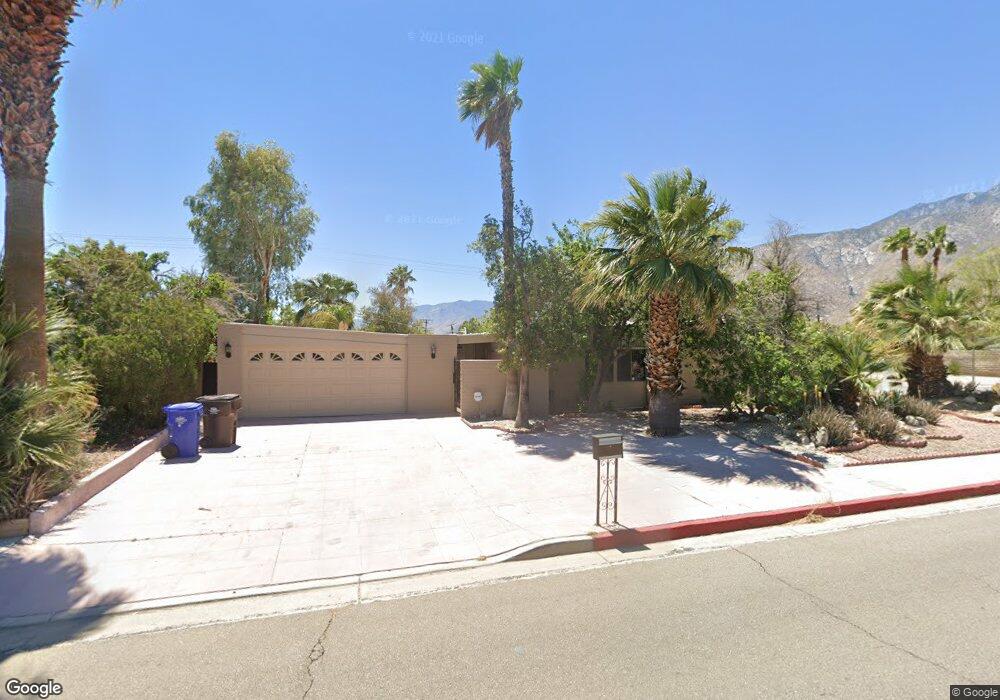
601 E Racquet Club Rd Palm Springs, CA 92262
Racquet Club Estates NeighborhoodEstimated Value: $669,507 - $1,229,000
3
Beds
2
Baths
2,092
Sq Ft
$428/Sq Ft
Est. Value
About This Home
This home is located at 601 E Racquet Club Rd, Palm Springs, CA 92262 and is currently estimated at $896,377, approximately $428 per square foot. 601 E Racquet Club Rd is a home located in Riverside County with nearby schools including Vista Del Monte Elementary School, Raymond Cree Middle School, and Palm Springs High School.
Ownership History
Date
Name
Owned For
Owner Type
Purchase Details
Closed on
Aug 7, 2023
Sold by
Possidon Constantina A
Bought by
Hildebrand-Possidon Living Trust and Possidon
Current Estimated Value
Purchase Details
Closed on
Mar 12, 2021
Sold by
Possidon Sophia C
Bought by
Casey Christopher J and Possidon Sophia C
Purchase Details
Closed on
Jul 6, 2015
Sold by
Hildebrand Mylo G
Bought by
Possidon Constantina A
Purchase Details
Closed on
Mar 1, 2008
Sold by
Possidon Theony Giannos
Bought by
Possidon Theony
Purchase Details
Closed on
May 12, 2005
Sold by
Possidon Theony
Bought by
Heying William
Purchase Details
Closed on
Sep 22, 2004
Sold by
Possidon Theony and Possidon Sophia Constantina
Bought by
Possidon Theony Giannos
Create a Home Valuation Report for This Property
The Home Valuation Report is an in-depth analysis detailing your home's value as well as a comparison with similar homes in the area
Home Values in the Area
Average Home Value in this Area
Purchase History
| Date | Buyer | Sale Price | Title Company |
|---|---|---|---|
| Hildebrand-Possidon Living Trust | -- | None Listed On Document | |
| Hildebrand-Possidon Living Trust | -- | None Listed On Document | |
| Casey Christopher J | -- | None Available | |
| Possidon Constantina A | -- | None Available | |
| Possidon Sophia C | -- | None Available | |
| Possidon Sophia C | -- | None Available | |
| Possidon Theony | -- | None Available | |
| Possidon Theony | -- | None Available | |
| Heying William | $160,000 | -- | |
| Possidon Theony Giannos | -- | -- |
Source: Public Records
Tax History Compared to Growth
Tax History
| Year | Tax Paid | Tax Assessment Tax Assessment Total Assessment is a certain percentage of the fair market value that is determined by local assessors to be the total taxable value of land and additions on the property. | Land | Improvement |
|---|---|---|---|---|
| 2025 | $1,816 | $129,855 | $11,739 | $118,116 |
| 2023 | $1,846 | $124,814 | $11,284 | $113,530 |
| 2022 | $1,848 | $122,367 | $11,063 | $111,304 |
| 2021 | $1,815 | $119,969 | $10,848 | $109,121 |
| 2020 | $1,743 | $118,740 | $10,737 | $108,003 |
| 2019 | $1,716 | $116,413 | $10,527 | $105,886 |
| 2018 | $1,687 | $114,131 | $10,322 | $103,809 |
| 2017 | $1,664 | $111,894 | $10,120 | $101,774 |
| 2016 | $1,621 | $109,701 | $9,922 | $99,779 |
| 2015 | $1,459 | $108,055 | $9,774 | $98,281 |
| 2014 | $1,423 | $105,940 | $9,584 | $96,356 |
Source: Public Records
Map
Nearby Homes
- 600 E Alexander Way
- 576 E Desert Holly Cir
- 784 E Alexander Way
- 444 E Glen Cir N
- 2197 Jacques Dr
- 2272 N Starr Rd
- 811 E Grace Cir
- 859 E Grace Cir
- 2211 N Starr Rd
- 2101 N Berne Dr
- 971 E Alexander Way
- 888 E Janet Cir
- 2252 N Indian Canyon Dr Unit E
- 1055 E Racquet Club Rd
- 200 E Racquet Club Rd Unit 69
- 200 E Racquet Club Rd Unit 72
- 200 E Racquet Club Rd Unit 60
- 205 The River
- 2653 N Kitty Hawk Dr
- 2023 N Via Miraleste Unit 1022
- 600 E Spencer Dr
- 656 E Spencer Dr
- 595 E Racquet Club Rd
- 2409 N Via Miraleste
- 2399 N Via Miraleste
- 688 E Spencer Dr
- 675 E Racquet Club Rd
- 603 E Spencer Dr
- 585 E Racquet Club Rd
- 653 E Spencer Dr
- 681 E Spencer Dr
- 712 E Spencer Dr
- 2500 N Starr Rd
- 757 E Racquet
- 703 E Racquet Club Rd
- 2369 N Via Miraleste
- 2390 N Trail Cir
- 715 E Spencer Dr
- 2365 N Trail Cir
- 2522 N Starr Rd