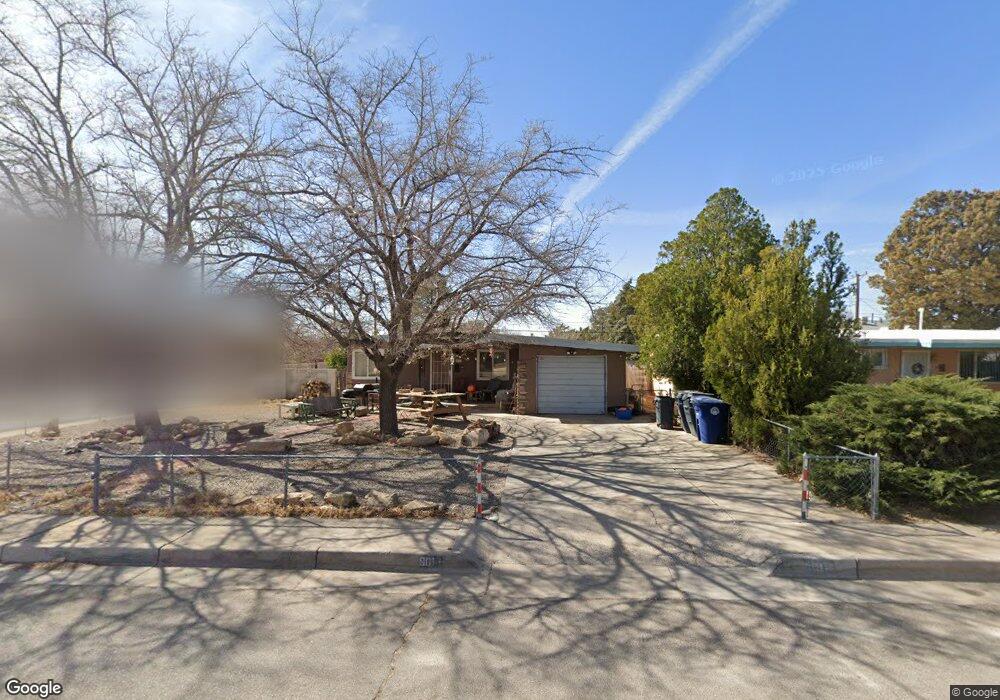
601 Espanola St NE Albuquerque, NM 87108
Fairgrounds NeighborhoodEstimated Value: $236,000 - $255,777
3
Beds
2
Baths
1,230
Sq Ft
$202/Sq Ft
Est. Value
About This Home
This home is located at 601 Espanola St NE, Albuquerque, NM 87108 and is currently estimated at $248,194, approximately $201 per square foot. 601 Espanola St NE is a home located in Bernalillo County with nearby schools including Mark Twain Elementary School, Hayes Middle School, and Highland High School.
Ownership History
Date
Name
Owned For
Owner Type
Purchase Details
Closed on
Mar 8, 2022
Sold by
Valencia Melissa S
Bought by
Valencia David A
Current Estimated Value
Purchase Details
Closed on
Nov 5, 2004
Sold by
Cordova Michael C and Cordova Kimberly J
Bought by
Valencia David A
Home Financials for this Owner
Home Financials are based on the most recent Mortgage that was taken out on this home.
Original Mortgage
$113,500
Interest Rate
5.66%
Mortgage Type
Purchase Money Mortgage
Purchase Details
Closed on
Jun 26, 1998
Sold by
Bovay Bartlett E
Bought by
Cordova Michael C and Cordova Kimberly J
Home Financials for this Owner
Home Financials are based on the most recent Mortgage that was taken out on this home.
Original Mortgage
$93,933
Interest Rate
7.13%
Mortgage Type
FHA
Purchase Details
Closed on
Oct 24, 1997
Sold by
Bovay Kevin M
Bought by
Bovay Bartlett F
Create a Home Valuation Report for This Property
The Home Valuation Report is an in-depth analysis detailing your home's value as well as a comparison with similar homes in the area
Home Values in the Area
Average Home Value in this Area
Purchase History
| Date | Buyer | Sale Price | Title Company |
|---|---|---|---|
| Valencia David A | -- | None Listed On Document | |
| Valencia David A | -- | First American Title Ins Co | |
| Cordova Michael C | -- | Rio Grande Title Company Inc | |
| Bovay Bartlett F | -- | -- |
Source: Public Records
Mortgage History
| Date | Status | Borrower | Loan Amount |
|---|---|---|---|
| Previous Owner | Valencia David A | $113,500 | |
| Previous Owner | Cordova Michael C | $93,933 | |
| Closed | Cordova Michael C | $3,419 |
Source: Public Records
Tax History Compared to Growth
Tax History
| Year | Tax Paid | Tax Assessment Tax Assessment Total Assessment is a certain percentage of the fair market value that is determined by local assessors to be the total taxable value of land and additions on the property. | Land | Improvement |
|---|---|---|---|---|
| 2024 | $1,593 | $39,760 | $11,272 | $28,488 |
| 2023 | $1,564 | $38,603 | $10,944 | $27,659 |
| 2022 | $1,509 | $37,478 | $10,625 | $26,853 |
| 2021 | $1,456 | $36,387 | $10,316 | $26,071 |
| 2020 | $1,430 | $35,327 | $10,015 | $25,312 |
| 2019 | $1,385 | $34,299 | $9,724 | $24,575 |
| 2018 | $1,333 | $34,299 | $9,724 | $24,575 |
| 2017 | $1,290 | $33,300 | $9,441 | $23,859 |
| 2016 | $1,273 | $31,927 | $9,441 | $22,486 |
| 2015 | $30,997 | $30,997 | $9,166 | $21,831 |
| 2014 | $1,243 | $31,264 | $9,166 | $22,098 |
| 2013 | -- | $32,965 | $8,330 | $24,635 |
Source: Public Records
Map
Nearby Homes
- 610 Espanola St NE
- 513 Mesilla St NE
- 645 Grove St NE
- 422 Chama St NE
- 335 Alcazar St NE
- 407 Dallas St NE
- 240 Chama St NE
- 330 Charleston St NE
- 128 Rhode Island St NE
- 310 Grove St NE
- 323 Dallas St NE
- 240 San Pablo St NE
- 236 San Pablo St NE
- 325 Rhode Island St NE
- 321 Rhode Island St NE
- 6901 Lomas Blvd NE
- 138 Mesilla St NE
- 325 Tennessee St NE
- 219 Dallas St NE
- 1212 Kentucky St NE
- 605 Espanola St NE Unit 3
- 609 Espanola St NE
- 609 Espanola St NE Unit 3
- 502 Mesilla St NE
- 602 Espanola St NE
- 506 Mesilla St NE
- 438 Mesilla St NE
- 533 Espanola St NE
- 538 Espanola St NE
- 510 Mesilla St NE
- 434 Mesilla St NE
- 613 Espanola St NE
- 529 Espanola St NE
- 617 Espanola St NE
- 430 Mesilla St NE
- 614 Espanola St NE
- 518 Mesilla St NE
- 525 Espanola St NE
- 530 Espanola St NE
- 522 Mesilla St NE