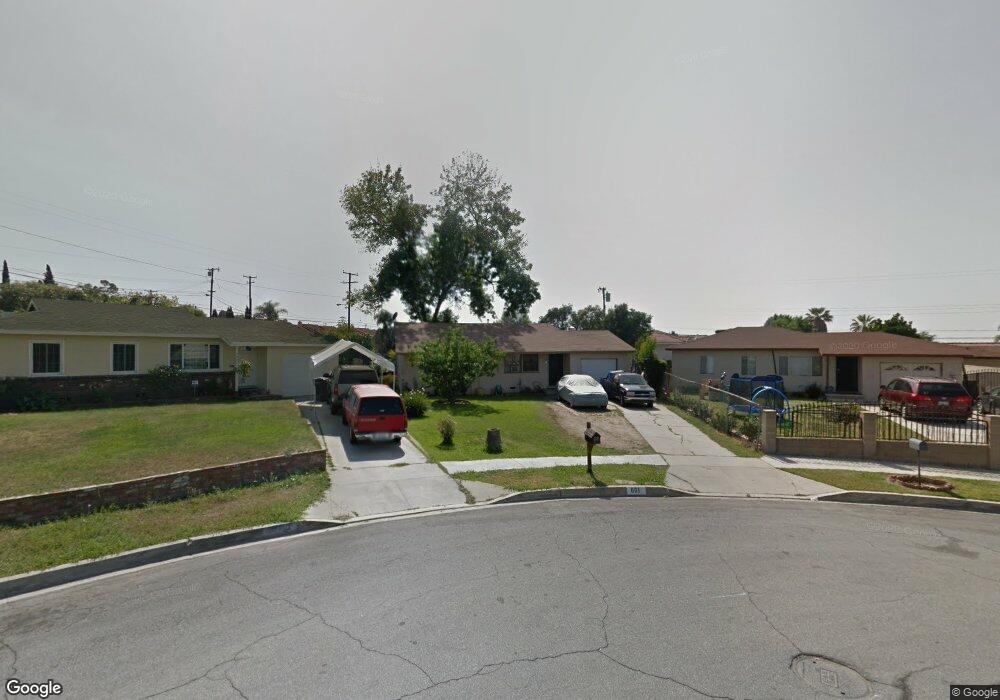
601 Gilwood Ave La Puente, CA 91744
Estimated Value: $661,000 - $773,000
4
Beds
2
Baths
1,146
Sq Ft
$625/Sq Ft
Est. Value
About This Home
This home is located at 601 Gilwood Ave, La Puente, CA 91744 and is currently estimated at $716,667, approximately $625 per square foot. 601 Gilwood Ave is a home located in Los Angeles County with nearby schools including Del Valle Elementary School, Sierra Vista Middle School, and La Puente High School.
Ownership History
Date
Name
Owned For
Owner Type
Purchase Details
Closed on
Jan 17, 2019
Sold by
Ortiz Olga
Bought by
Dixon John Andrew
Current Estimated Value
Home Financials for this Owner
Home Financials are based on the most recent Mortgage that was taken out on this home.
Original Mortgage
$277,000
Outstanding Balance
$243,539
Interest Rate
4.6%
Mortgage Type
New Conventional
Estimated Equity
$473,128
Purchase Details
Closed on
Aug 19, 1999
Sold by
Ortiz William Ralph
Bought by
Ortiz Olga
Home Financials for this Owner
Home Financials are based on the most recent Mortgage that was taken out on this home.
Original Mortgage
$126,350
Interest Rate
7.56%
Purchase Details
Closed on
Jul 8, 1999
Sold by
Trust Braasch Herman L And Ellen Trs Bra
Bought by
Ortiz Olga
Home Financials for this Owner
Home Financials are based on the most recent Mortgage that was taken out on this home.
Original Mortgage
$126,350
Interest Rate
7.56%
Create a Home Valuation Report for This Property
The Home Valuation Report is an in-depth analysis detailing your home's value as well as a comparison with similar homes in the area
Home Values in the Area
Average Home Value in this Area
Purchase History
| Date | Buyer | Sale Price | Title Company |
|---|---|---|---|
| Dixon John Andrew | $434,000 | Chicago Title Company | |
| Ortiz Olga | -- | Fidelity National Title Co | |
| Ortiz Olga | $133,000 | Fidelity National Title Co |
Source: Public Records
Mortgage History
| Date | Status | Borrower | Loan Amount |
|---|---|---|---|
| Open | Dixon John Andrew | $277,000 | |
| Previous Owner | Ortiz Olga | $126,350 | |
| Closed | Ortiz Olga | $6,650 |
Source: Public Records
Tax History Compared to Growth
Tax History
| Year | Tax Paid | Tax Assessment Tax Assessment Total Assessment is a certain percentage of the fair market value that is determined by local assessors to be the total taxable value of land and additions on the property. | Land | Improvement |
|---|---|---|---|---|
| 2025 | $6,065 | $484,131 | $372,581 | $111,550 |
| 2024 | $6,065 | $474,639 | $365,276 | $109,363 |
| 2023 | $5,912 | $465,333 | $358,114 | $107,219 |
| 2022 | $5,741 | $456,210 | $351,093 | $105,117 |
| 2021 | $5,642 | $447,265 | $344,209 | $103,056 |
| 2019 | $2,637 | $183,231 | $110,491 | $72,740 |
| 2018 | $4,454 | $179,639 | $108,325 | $71,314 |
| 2016 | $2,361 | $172,665 | $104,119 | $68,546 |
| 2015 | $2,319 | $170,073 | $102,556 | $67,517 |
| 2014 | $2,292 | $166,743 | $100,548 | $66,195 |
Source: Public Records
Map
Nearby Homes
- 545 N 5th St
- 15879 Hill St
- 15732 Victoria Ave
- 665 Larimore Ave
- 15900 Rowland St
- 826 Del Valle Ave
- 15625 Loukelton St
- 15416 Giordano St
- 138 Banbridge Ave
- 16322 Main St
- 16115 Central Ave
- 15246 Temple Ave
- 11 Alley Way
- 16149 Abbey St
- 16142 Abbey St
- 1084 Del Valle Ave
- 15925 Amar Rd
- 15937 Amar Rd
- 15943 Amar Rd
- 15947 Amar Rd
- 15902 Cambay St
- 605 Gilwood Ave
- 15906 Cambay St
- 628 N 5th St
- 609 Gilwood Ave
- 618 N 5th St Unit 3
- 622 N 5th St Unit 3
- 620 N 5th St Unit 4
- 618 N 5th St
- 616 N 5th St
- 614 N 5th St Unit 1
- 626 N 5th St
- 15910 Cambay St
- 615 Gilwood Ave
- 608 Gilwood Ave
- 15905 Picton St
- 15916 Cambay St
- 621 Gilwood Ave
- 610 N 5th St
- 614 Gilwood Ave