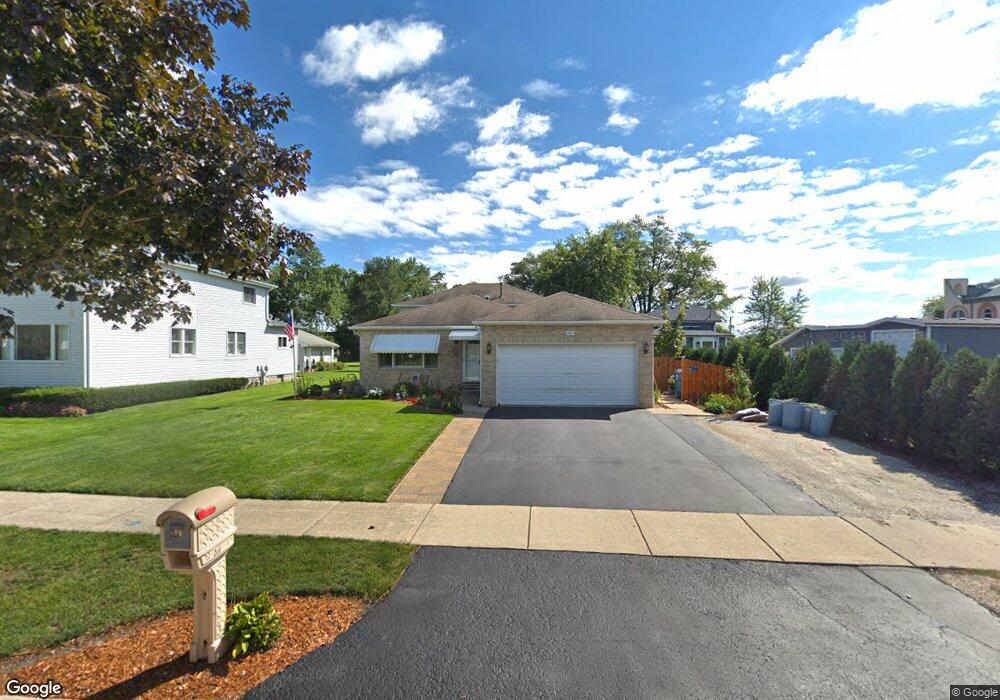
601 John St Bensenville, IL 60106
Estimated Value: $406,168 - $488,000
--
Bed
1
Bath
2,100
Sq Ft
$213/Sq Ft
Est. Value
About This Home
This home is located at 601 John St, Bensenville, IL 60106 and is currently estimated at $448,292, approximately $213 per square foot. 601 John St is a home located in DuPage County with nearby schools including Tioga Elementary School, Blackhawk Middle School, and Fenton High School.
Ownership History
Date
Name
Owned For
Owner Type
Purchase Details
Closed on
Jun 24, 2004
Sold by
Dausch Melanie Rodgers and Dausch Melanie R
Bought by
Dausch Tod C and Dausch Melanie R
Current Estimated Value
Home Financials for this Owner
Home Financials are based on the most recent Mortgage that was taken out on this home.
Original Mortgage
$40,000
Interest Rate
6.42%
Mortgage Type
Stand Alone Refi Refinance Of Original Loan
Purchase Details
Closed on
Nov 16, 1994
Sold by
Carey Michael
Bought by
Dausch Melanie Rogers
Home Financials for this Owner
Home Financials are based on the most recent Mortgage that was taken out on this home.
Original Mortgage
$168,730
Interest Rate
8.91%
Purchase Details
Closed on
Dec 15, 1993
Sold by
Ogletree Earl and Ogletree Gerda
Bought by
Carey Michael
Create a Home Valuation Report for This Property
The Home Valuation Report is an in-depth analysis detailing your home's value as well as a comparison with similar homes in the area
Home Values in the Area
Average Home Value in this Area
Purchase History
| Date | Buyer | Sale Price | Title Company |
|---|---|---|---|
| Dausch Tod C | -- | Stewart Title Guaranty Compa | |
| Dausch Melanie Rogers | $169,000 | First American Title Insuran | |
| Carey Michael | $45,000 | First American Title Insuran |
Source: Public Records
Mortgage History
| Date | Status | Borrower | Loan Amount |
|---|---|---|---|
| Closed | Dausch Tod C | $40,000 | |
| Closed | Dausch Melanie Rogers | $168,730 |
Source: Public Records
Tax History Compared to Growth
Tax History
| Year | Tax Paid | Tax Assessment Tax Assessment Total Assessment is a certain percentage of the fair market value that is determined by local assessors to be the total taxable value of land and additions on the property. | Land | Improvement |
|---|---|---|---|---|
| 2024 | $9,697 | $127,533 | $38,856 | $88,677 |
| 2023 | $9,125 | $117,240 | $35,720 | $81,520 |
| 2022 | $8,996 | $109,890 | $33,210 | $76,680 |
| 2021 | $8,513 | $105,260 | $31,810 | $73,450 |
| 2020 | $8,695 | $100,820 | $30,470 | $70,350 |
| 2019 | $8,199 | $96,940 | $29,300 | $67,640 |
| 2018 | $8,059 | $93,850 | $29,300 | $64,550 |
| 2017 | $7,800 | $89,690 | $28,000 | $61,690 |
| 2016 | $7,497 | $82,810 | $25,850 | $56,960 |
| 2015 | $7,282 | $76,500 | $23,880 | $52,620 |
| 2014 | $7,664 | $79,600 | $27,360 | $52,240 |
| 2013 | $7,594 | $81,230 | $27,920 | $53,310 |
Source: Public Records
Map
Nearby Homes
- 669 Redmond Ct
- 809 Brentwood Dr
- 859 John St
- 499 Park St Unit 2D
- 342 Diana Ct
- 311 George St
- 284 E Jefferson St
- 128 David Dr
- 3112 Pearl Ave
- 424 May St
- 449 S Addison St
- 1043 S York Rd Unit 209
- 1043 S York Rd Unit 208
- 1043 S York Rd Unit 411
- 1043 S York Rd Unit 605
- 245 S Addison St
- 227-239 W Irving Park Rd
- 11353 W Grand Ave
- 3N276 N Howard Ave
- 2939 Haber Ave
- 591 John St
- 633 John St
- 581 John St
- 571 John St
- 647 John St
- 66981 S John St
- 626 County Line Rd
- 640 County Line Rd
- 600 County Line Rd Unit 1NW
- 600 County Line Rd Unit 1N
- 600 County Line Rd Unit 1NWH
- 600 County Line Rd Unit 1SW
- 600 County Line Rd Unit 1SE
- 600 County Line Rd Unit 2SE
- 600 County Line Rd
- 675 John St
- 570 County Line Rd
- 620 County Line Rd
- 556 County Line Rd Unit D
- 687 John St