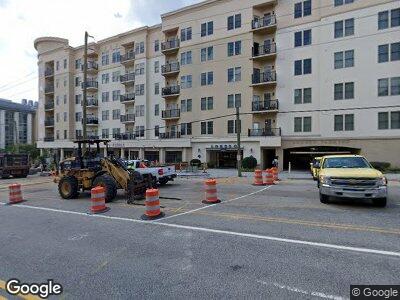
Adesso 601 Main St Unit 228 Columbia, SC 29201
University Hill NeighborhoodEstimated Value: $224,000 - $236,000
1
Bed
1
Bath
794
Sq Ft
$289/Sq Ft
Est. Value
About This Home
This home is located at 601 Main St Unit 228, Columbia, SC 29201 and is currently estimated at $229,476, approximately $289 per square foot. 601 Main St Unit 228 is a home located in Richland County with nearby schools including A. C. Moore Elementary School, Hand Middle School, and Dreher High School.
Ownership History
Date
Name
Owned For
Owner Type
Purchase Details
Closed on
Jan 9, 2025
Sold by
Slappy Ashley L
Bought by
Jacobs Joe and Jacobs Vernetta
Current Estimated Value
Purchase Details
Closed on
Feb 24, 2022
Sold by
Ryan Burch Spencer
Bought by
Slappy Ashley L
Home Financials for this Owner
Home Financials are based on the most recent Mortgage that was taken out on this home.
Original Mortgage
$182,000
Interest Rate
3.5%
Mortgage Type
New Conventional
Purchase Details
Closed on
Aug 11, 2017
Sold by
Tassello Joann and Tassello Marisa
Bought by
Burch Spencer Ryan and Burch Emily Williams
Home Financials for this Owner
Home Financials are based on the most recent Mortgage that was taken out on this home.
Original Mortgage
$148,000
Interest Rate
4.25%
Mortgage Type
Adjustable Rate Mortgage/ARM
Purchase Details
Closed on
Jul 14, 2010
Sold by
Adesso/Columbia Llc
Bought by
Tassello Anthony S and Tassello Joann
Create a Home Valuation Report for This Property
The Home Valuation Report is an in-depth analysis detailing your home's value as well as a comparison with similar homes in the area
Home Values in the Area
Average Home Value in this Area
Purchase History
| Date | Buyer | Sale Price | Title Company |
|---|---|---|---|
| Jacobs Joe | $232,500 | None Listed On Document | |
| Jacobs Joe | $232,500 | None Listed On Document | |
| Slappy Ashley L | $182,000 | Harvey & Vallini Llc | |
| Burch Spencer Ryan | $185,000 | None Available | |
| Tassello Anthony S | $175,000 | -- |
Source: Public Records
Mortgage History
| Date | Status | Borrower | Loan Amount |
|---|---|---|---|
| Previous Owner | Slappy Ashley L | $182,000 | |
| Previous Owner | Burch Spencer Ryan | $148,000 |
Source: Public Records
Tax History Compared to Growth
Tax History
| Year | Tax Paid | Tax Assessment Tax Assessment Total Assessment is a certain percentage of the fair market value that is determined by local assessors to be the total taxable value of land and additions on the property. | Land | Improvement |
|---|---|---|---|---|
| 2024 | $4,743 | $173,400 | $27,000 | $146,400 |
| 2023 | $4,743 | $7,400 | $0 | $0 |
| 2022 | $5,349 | $185,000 | $5,000 | $180,000 |
| 2021 | $0 | $11,100 | $0 | $0 |
| 2020 | $5,469 | $11,100 | $0 | $0 |
| 2019 | $5,484 | $11,100 | $0 | $0 |
| 2018 | $5,551 | $11,100 | $0 | $0 |
| 2017 | $1,268 | $6,400 | $0 | $0 |
| 2016 | $1,223 | $6,400 | $0 | $0 |
| 2015 | $1,223 | $6,400 | $0 | $0 |
| 2014 | $1,222 | $160,000 | $0 | $0 |
| 2013 | -- | $6,400 | $0 | $0 |
Source: Public Records
About Adesso
Map
Nearby Homes
- 601 Main St Unit 425
- 1100 Wheat St Unit 811
- 1100 Wheat St Unit 711
- 1600 Park Cir Unit 804
- 1600 Park Cir Unit 811
- 1709 Phelps St
- 1704 Phelps St
- 1716 Phelps St
- 1520 Senate St Unit 159
- 1520 Senate St Unit 188
- 1520 Senate St Unit 59
- 1520 Senate St Unit 203
- 1520 Senate St Unit 116 | 11F
- 1700 Catawba St
- 28 Bluff Rd
- 820 Heyward St
- 34 Bluff Rd
- 1700 Senate St
- 217 Church St
- 422 Edisto Ave
- 601 Main St
- 601 Main St Unit B
- 601 Main St Unit 215
- 601 Main St Unit 129
- 601 Main St Unit 115
- 601 Main St Unit 101
- 601 Main St Unit 205
- 601 Main St Unit 303
- 601 Main St Unit 502
- 601 Main St Unit 102
- 601 Main St Unit 515
- 601 Main St Unit 504
- 601 Main St Unit 226
- 601 Main St Unit 127
- 601 Main St Unit 311
- 601 Main St Unit 312
- 601 Main St Unit 401
- 601 Main St Unit 516
- 601 Main St Unit 410
- 601 Main St Unit 305