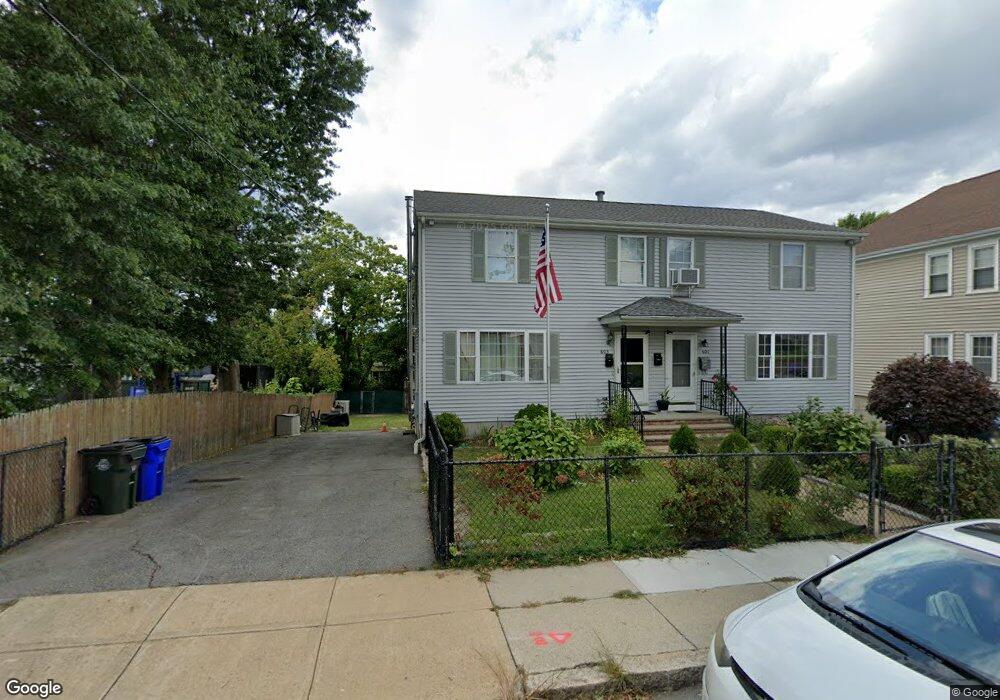
601 S Almond St Unit 603 Fall River, MA 02724
Sandy Beach NeighborhoodEstimated Value: $543,000 - $671,000
6
Beds
6
Baths
1,760
Sq Ft
$333/Sq Ft
Est. Value
About This Home
This home is located at 601 S Almond St Unit 603, Fall River, MA 02724 and is currently estimated at $585,752, approximately $332 per square foot. 601 S Almond St Unit 603 is a home located in Bristol County with nearby schools including Carlton M. Viveiros Elementary School, Matthew J. Kuss Middle School, and B M C Durfee High School.
Ownership History
Date
Name
Owned For
Owner Type
Purchase Details
Closed on
Mar 24, 1999
Sold by
Dream Homes Inc
Bought by
Rebello Joseph A and Rebello Christine P
Current Estimated Value
Home Financials for this Owner
Home Financials are based on the most recent Mortgage that was taken out on this home.
Original Mortgage
$121,000
Outstanding Balance
$29,360
Interest Rate
6.78%
Mortgage Type
Purchase Money Mortgage
Estimated Equity
$556,392
Create a Home Valuation Report for This Property
The Home Valuation Report is an in-depth analysis detailing your home's value as well as a comparison with similar homes in the area
Home Values in the Area
Average Home Value in this Area
Purchase History
| Date | Buyer | Sale Price | Title Company |
|---|---|---|---|
| Rebello Joseph A | $161,000 | -- |
Source: Public Records
Mortgage History
| Date | Status | Borrower | Loan Amount |
|---|---|---|---|
| Open | Rebello Joseph A | $121,000 |
Source: Public Records
Tax History Compared to Growth
Tax History
| Year | Tax Paid | Tax Assessment Tax Assessment Total Assessment is a certain percentage of the fair market value that is determined by local assessors to be the total taxable value of land and additions on the property. | Land | Improvement |
|---|---|---|---|---|
| 2025 | $5,864 | $512,100 | $111,500 | $400,600 |
| 2024 | $5,334 | $464,200 | $107,400 | $356,800 |
| 2023 | $5,047 | $411,300 | $88,700 | $322,600 |
| 2022 | $4,666 | $369,700 | $84,500 | $285,200 |
| 2021 | $4,312 | $311,800 | $80,400 | $231,400 |
| 2020 | $3,848 | $266,300 | $79,200 | $187,100 |
| 2019 | $3,636 | $249,400 | $76,300 | $173,100 |
| 2018 | $3,500 | $239,400 | $82,600 | $156,800 |
| 2017 | $3,184 | $227,400 | $78,800 | $148,600 |
| 2016 | $3,120 | $228,900 | $83,800 | $145,100 |
| 2015 | $3,025 | $231,300 | $83,800 | $147,500 |
| 2014 | $3,033 | $241,100 | $81,300 | $159,800 |
Source: Public Records
Map
Nearby Homes
- 484 S Beach St
- 785 Broadway
- 31 Barker St
- 1175 S Main St
- 1173 S Main St
- 1273-1279 S Main St
- 1313 So Main St Unit 2
- 404 Bradford Ave
- 1039 S Main St
- 420 Bradford Ave
- 20 Wilcox St
- 36 Palmer St
- 1334 S Main St
- 11 Palmer St
- 403 Division St Unit 14
- 403 Division St Unit 13
- 403 Division St Unit 5
- 403 Division St Unit 9
- 403 Division St Unit 8
- 403 Division St Unit 11
- 603 S Almond St Unit 1
- 587 S Almond St
- 621 S Almond St
- 569 S Almond St Unit 571
- 110 Ash St Unit 6
- 110 Ash St Unit 5
- 110 Ash St Unit 4
- 110 Ash St Unit 3
- 110 Ash St Unit 2
- 110 Ash St Unit 1
- 100 Ash St
- 88 Ash St
- 124 Ash St Unit 3S
- 124 Ash St
- 598 S Almond St
- 610 S Almond St
- 561 S Almond St
- 625 S Almond St
- 584 S Almond St
- 618 S Almond St