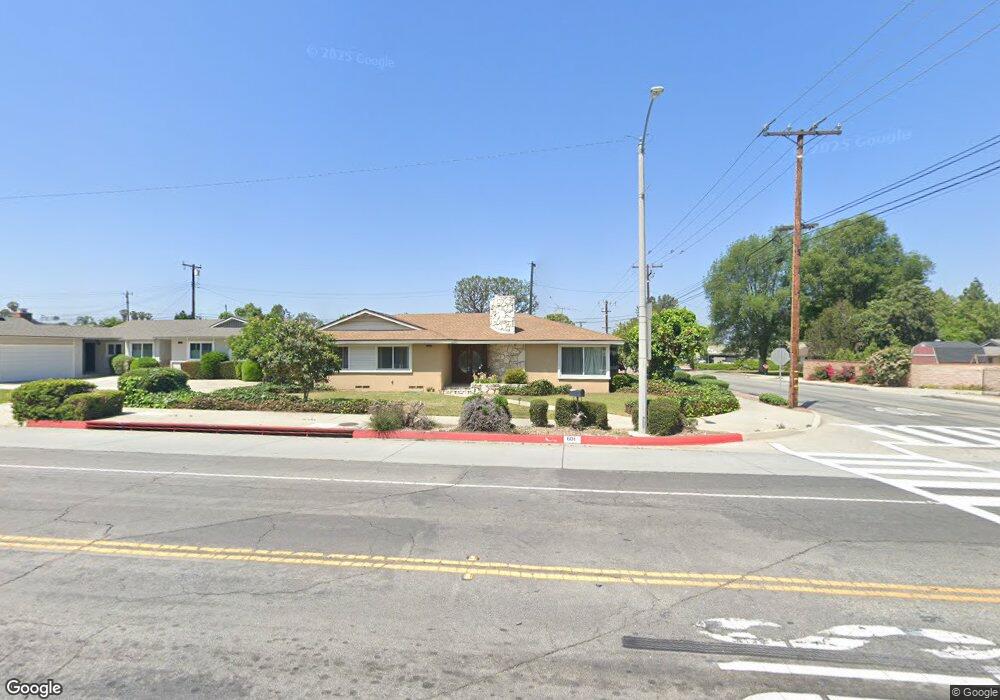
601 S Citrus St West Covina, CA 91791
South Hills NeighborhoodEstimated Value: $910,000 - $1,319,000
3
Beds
3
Baths
2,280
Sq Ft
$477/Sq Ft
Est. Value
About This Home
This home is located at 601 S Citrus St, West Covina, CA 91791 and is currently estimated at $1,087,162, approximately $476 per square foot. 601 S Citrus St is a home located in Los Angeles County with nearby schools including Mesa Elementary School, South Hills High School, and Christ Lutheran School.
Ownership History
Date
Name
Owned For
Owner Type
Purchase Details
Closed on
Nov 21, 2005
Sold by
Chavez Ruben
Bought by
Chavez Ruben and Chavez Inez
Current Estimated Value
Home Financials for this Owner
Home Financials are based on the most recent Mortgage that was taken out on this home.
Original Mortgage
$364,000
Outstanding Balance
$218,532
Interest Rate
7.65%
Mortgage Type
Balloon
Estimated Equity
$868,630
Purchase Details
Closed on
May 17, 1999
Sold by
Chavez Ruben and Gonzalez Chavez Inez
Bought by
Chavez Ruben
Home Financials for this Owner
Home Financials are based on the most recent Mortgage that was taken out on this home.
Original Mortgage
$213,500
Interest Rate
6.92%
Purchase Details
Closed on
Aug 14, 1997
Sold by
Knox Trust and Raeline
Bought by
Chavez Ruben and Andrade Silvia
Home Financials for this Owner
Home Financials are based on the most recent Mortgage that was taken out on this home.
Original Mortgage
$210,520
Interest Rate
7.44%
Purchase Details
Closed on
Oct 19, 1995
Sold by
Knox Arthur R
Bought by
Knox Arthur R
Create a Home Valuation Report for This Property
The Home Valuation Report is an in-depth analysis detailing your home's value as well as a comparison with similar homes in the area
Home Values in the Area
Average Home Value in this Area
Purchase History
| Date | Buyer | Sale Price | Title Company |
|---|---|---|---|
| Chavez Ruben | -- | United Title Company | |
| Chavez Ruben | -- | Benefit Land Title | |
| Chavez Ruben | $222,000 | First American | |
| Chavez Ruben | -- | First American | |
| Knox Arthur R | -- | -- |
Source: Public Records
Mortgage History
| Date | Status | Borrower | Loan Amount |
|---|---|---|---|
| Open | Chavez Ruben | $364,000 | |
| Closed | Chavez Ruben | $213,500 | |
| Previous Owner | Chavez Ruben | $210,520 |
Source: Public Records
Tax History Compared to Growth
Tax History
| Year | Tax Paid | Tax Assessment Tax Assessment Total Assessment is a certain percentage of the fair market value that is determined by local assessors to be the total taxable value of land and additions on the property. | Land | Improvement |
|---|---|---|---|---|
| 2025 | $5,082 | $384,615 | $135,695 | $248,920 |
| 2024 | $5,082 | $377,075 | $133,035 | $244,040 |
| 2023 | $5,010 | $369,682 | $130,427 | $239,255 |
| 2022 | $4,944 | $362,434 | $127,870 | $234,564 |
| 2021 | $4,864 | $355,328 | $125,363 | $229,965 |
| 2019 | $4,747 | $344,791 | $121,646 | $223,145 |
| 2018 | $4,443 | $338,031 | $119,261 | $218,770 |
| 2016 | $4,173 | $324,907 | $114,631 | $210,276 |
| 2015 | $4,067 | $320,028 | $112,910 | $207,118 |
| 2014 | $4,017 | $313,760 | $110,699 | $203,061 |
Source: Public Records
Map
Nearby Homes
- 2551 E Larkwood St
- 2249 E Rio Verde Dr
- 2837 E Mesa Dr
- 920 S Spring Meadow Dr
- 802 S Hollenbeck St
- 512 S Barranca St
- 2147 E Rio Verde Dr
- 950 S Spring Meadow Dr
- 3033 E Sunset Hill Dr
- 1103 Novarro St
- 2828 Far View Ln
- 130 S Barranca St Unit 302
- 1003 S Rodilee Ave
- 110 S Baymar St
- 859 S Hillward Ave
- 1940 E Walnut Creek Pkwy
- 1467 S Montezuma Way
- 3264 E Holt Ave
- 417 S Charvers Ave
- 1327 S Hollencrest Dr
- 609 S Citrus St
- 2602 E Cortez St
- 600 S Acacia Ln
- 608 S Acacia Ln
- 615 S Citrus St
- 521 S Citrus St
- 614 S Acacia Ln
- 2608 E Cortez St
- 2537 E Cortez St
- 621 S Citrus St
- 2603 E Larkwood St
- 618 S Acacia Ln
- 2610 E Cortez St
- 601 S Acacia Ln
- 609 S Acacia Ln
- 615 S Acacia Ln
- 2613 E Larkwood St
- 2545 E Larkwood St
- 2537 E Larkwood St
- 619 S Acacia Ln