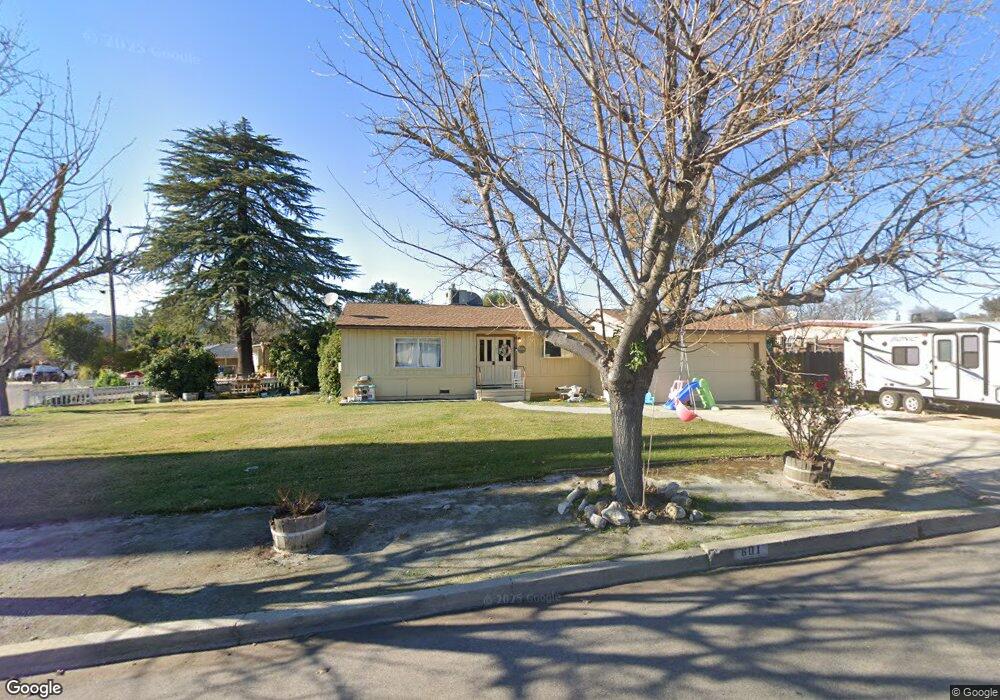
601 Tucker Ave Paso Robles, CA 93446
Estimated Value: $504,000 - $615,000
3
Beds
1
Bath
983
Sq Ft
$572/Sq Ft
Est. Value
About This Home
This home is located at 601 Tucker Ave, Paso Robles, CA 93446 and is currently estimated at $562,300, approximately $572 per square foot. 601 Tucker Ave is a home located in San Luis Obispo County with nearby schools including Winifred Pifer Elementary School, Daniel Lewis Middle School, and Paso Robles High School.
Ownership History
Date
Name
Owned For
Owner Type
Purchase Details
Closed on
Apr 15, 2019
Sold by
Wyrick Morey and Wyrick Janet
Bought by
Wages Zachary Mason and Wages Kaele Lynn
Current Estimated Value
Home Financials for this Owner
Home Financials are based on the most recent Mortgage that was taken out on this home.
Original Mortgage
$382,936
Outstanding Balance
$334,728
Interest Rate
4.12%
Mortgage Type
FHA
Estimated Equity
$227,572
Create a Home Valuation Report for This Property
The Home Valuation Report is an in-depth analysis detailing your home's value as well as a comparison with similar homes in the area
Purchase History
| Date | Buyer | Sale Price | Title Company |
|---|---|---|---|
| Wages Zachary Mason | $390,000 | Fidelity National Title Co |
Source: Public Records
Mortgage History
| Date | Status | Borrower | Loan Amount |
|---|---|---|---|
| Open | Wages Zachary Mason | $382,936 |
Source: Public Records
Tax History
| Year | Tax Paid | Tax Assessment Tax Assessment Total Assessment is a certain percentage of the fair market value that is determined by local assessors to be the total taxable value of land and additions on the property. | Land | Improvement |
|---|---|---|---|---|
| 2025 | $1,945 | $178,423 | $84,963 | $93,460 |
| 2024 | $1,913 | $174,926 | $83,298 | $91,628 |
| 2023 | $1,913 | $171,497 | $81,665 | $89,832 |
| 2022 | $1,885 | $168,135 | $80,064 | $88,071 |
| 2021 | $1,852 | $164,840 | $78,495 | $86,345 |
| 2020 | $1,827 | $163,151 | $77,691 | $85,460 |
| 2019 | $1,801 | $159,953 | $76,168 | $83,785 |
| 2018 | $1,777 | $156,818 | $74,675 | $82,143 |
| 2017 | $1,671 | $153,744 | $73,211 | $80,533 |
| 2016 | $1,638 | $150,730 | $71,776 | $78,954 |
| 2015 | $1,632 | $148,467 | $70,698 | $77,769 |
| 2014 | $1,575 | $145,560 | $69,314 | $76,246 |
Source: Public Records
Map
Nearby Homes
Your Personal Tour Guide
Ask me questions while you tour the home.