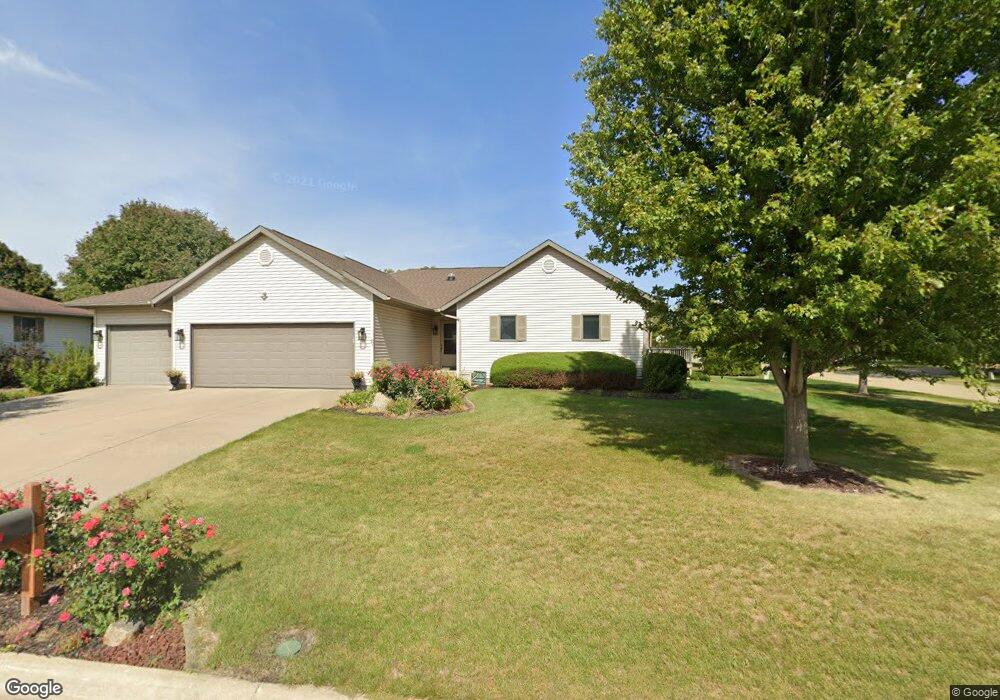
601 W 19th St Vinton, IA 52349
Estimated Value: $263,000 - $380,000
3
Beds
3
Baths
2,012
Sq Ft
$160/Sq Ft
Est. Value
About This Home
This home is located at 601 W 19th St, Vinton, IA 52349 and is currently estimated at $322,558, approximately $160 per square foot. 601 W 19th St is a home located in Benton County with nearby schools including Tilford Elementary School, Shellsburg Elementary School, and Vinton-Shellsburg Middle School.
Ownership History
Date
Name
Owned For
Owner Type
Purchase Details
Closed on
Feb 6, 2024
Sold by
Hansen Rosean L
Bought by
Rosean L Hansen Revocable Trust and Hansen
Current Estimated Value
Purchase Details
Closed on
Nov 2, 2023
Sold by
Hansen Gilbert L and Hansen Rosean L
Bought by
Gilbert L Hansen Jr Revocable Trust and Hansen
Purchase Details
Closed on
Jul 10, 2020
Sold by
Fischer Linda E
Bought by
Hansen Gilbert L and Hansen Rosean L
Purchase Details
Closed on
Oct 16, 2006
Sold by
Ferguson Loretta M and Ferguson Curtis L
Bought by
Hansen Gilbert L and Hansen Rosean L
Create a Home Valuation Report for This Property
The Home Valuation Report is an in-depth analysis detailing your home's value as well as a comparison with similar homes in the area
Home Values in the Area
Average Home Value in this Area
Purchase History
| Date | Buyer | Sale Price | Title Company |
|---|---|---|---|
| Rosean L Hansen Revocable Trust | -- | None Listed On Document | |
| Hansen Rosean L | -- | None Listed On Document | |
| Gilbert L Hansen Jr Revocable Trust | -- | None Listed On Document | |
| Hansen Gilbert L | -- | None Available | |
| Hansen Gilbert L | $178,000 | None Available |
Source: Public Records
Tax History Compared to Growth
Tax History
| Year | Tax Paid | Tax Assessment Tax Assessment Total Assessment is a certain percentage of the fair market value that is determined by local assessors to be the total taxable value of land and additions on the property. | Land | Improvement |
|---|---|---|---|---|
| 2025 | $4,568 | $297,500 | $38,800 | $258,700 |
| 2024 | $4,568 | $276,100 | $38,200 | $237,900 |
| 2023 | $4,640 | $276,100 | $38,200 | $237,900 |
| 2022 | $4,760 | $227,900 | $30,600 | $197,300 |
| 2021 | $4,760 | $227,900 | $30,600 | $197,300 |
| 2020 | $4,066 | $200,100 | $23,000 | $177,100 |
| 2019 | $4,126 | $200,100 | $23,000 | $177,100 |
| 2018 | $4,002 | $200,000 | $22,100 | $177,900 |
| 2017 | $3,844 | $200,000 | $22,100 | $177,900 |
| 2016 | $3,776 | $187,000 | $20,700 | $166,300 |
| 2015 | $3,776 | $187,000 | $20,700 | $166,300 |
| 2014 | $3,938 | $194,100 | $0 | $0 |
Source: Public Records
Map
Nearby Homes