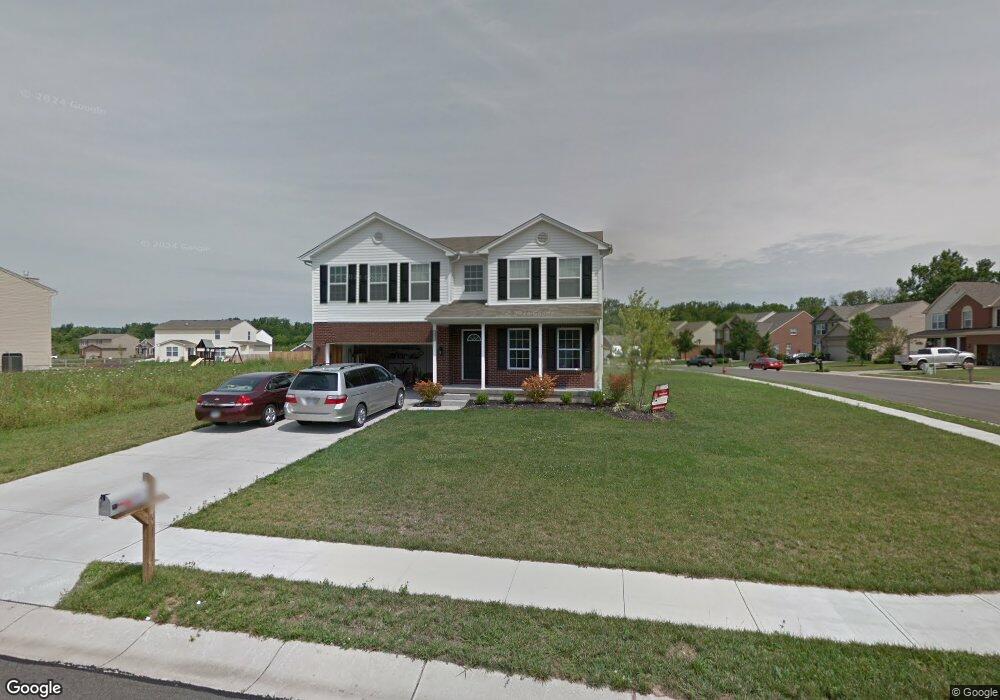
601 Windsor Ct Unit 4619 Trenton, OH 45067
Estimated Value: $360,000 - $427,000
4
Beds
3
Baths
3,204
Sq Ft
$126/Sq Ft
Est. Value
About This Home
This home is located at 601 Windsor Ct Unit 4619, Trenton, OH 45067 and is currently estimated at $404,806, approximately $126 per square foot. 601 Windsor Ct Unit 4619 is a home located in Butler County with nearby schools including Edgewood Intermediate School and Edgewood High School.
Ownership History
Date
Name
Owned For
Owner Type
Purchase Details
Closed on
Feb 3, 2021
Sold by
Sph Property Three Llc
Bought by
Quincy Jonathon
Current Estimated Value
Home Financials for this Owner
Home Financials are based on the most recent Mortgage that was taken out on this home.
Original Mortgage
$264,690
Outstanding Balance
$236,325
Interest Rate
2.6%
Mortgage Type
New Conventional
Estimated Equity
$168,481
Purchase Details
Closed on
Dec 4, 2020
Sold by
Anderson Jennifer R
Bought by
Anderson Jonathan P
Purchase Details
Closed on
Dec 1, 2020
Sold by
Anderson Jonathan P
Bought by
Sp 11 Property Three Llc
Purchase Details
Closed on
May 25, 2012
Sold by
T Hall Development Llc
Bought by
Anderson Jonathan P
Home Financials for this Owner
Home Financials are based on the most recent Mortgage that was taken out on this home.
Original Mortgage
$191,020
Interest Rate
3.9%
Mortgage Type
New Conventional
Create a Home Valuation Report for This Property
The Home Valuation Report is an in-depth analysis detailing your home's value as well as a comparison with similar homes in the area
Home Values in the Area
Average Home Value in this Area
Purchase History
| Date | Buyer | Sale Price | Title Company |
|---|---|---|---|
| Quincy Jonathon | $294,100 | None Available | |
| Anderson Jonathan P | -- | None Available | |
| Sp 11 Property Three Llc | $294,100 | None Available | |
| Anderson Jonathan P | $187,700 | None Available |
Source: Public Records
Mortgage History
| Date | Status | Borrower | Loan Amount |
|---|---|---|---|
| Open | Quincy Jonathon | $264,690 | |
| Previous Owner | Anderson Jonathan P | $191,020 |
Source: Public Records
Tax History Compared to Growth
Tax History
| Year | Tax Paid | Tax Assessment Tax Assessment Total Assessment is a certain percentage of the fair market value that is determined by local assessors to be the total taxable value of land and additions on the property. | Land | Improvement |
|---|---|---|---|---|
| 2024 | $5,149 | $1,390 | $1,390 | -- |
| 2023 | $5,125 | $119,970 | $11,960 | $108,010 |
| 2022 | $3,630 | $76,080 | $11,960 | $64,120 |
| 2021 | $3,580 | $76,080 | $11,960 | $64,120 |
| 2020 | $3,815 | $76,080 | $11,960 | $64,120 |
| 2019 | $4,131 | $72,000 | $11,130 | $60,870 |
| 2018 | $3,832 | $72,000 | $11,130 | $60,870 |
| 2017 | $3,835 | $72,000 | $11,130 | $60,870 |
| 2016 | $3,587 | $64,310 | $11,130 | $53,180 |
| 2015 | $3,060 | $64,310 | $11,130 | $53,180 |
| 2014 | $3,426 | $64,310 | $11,130 | $53,180 |
| 2013 | $3,426 | $67,180 | $13,070 | $54,110 |
Source: Public Records
Map
Nearby Homes
- 700 Holland Ct
- Welshire Plan at Maple View - Maple View Elk Creek
- Charleston II Plan at Maple View - Maple View Elk Creek
- Sienna Plan at Maple View - Maple View Elk Creek
- Bayview Deluxe Plan at Maple View - Maple View Elk Creek
- Bayview I Plan at Maple View - Maple View Elk Creek
- Bayview II Plan at Maple View - Maple View Elk Creek
- Springfield Plan at Maple View - Maple View Elk Creek
- Baybrook Plan at Maple View - Maple View Elk Creek
- Yorkshire Plan at Maple View - Maple View Elk Creek
- Savannah Plan at Maple View - Maple View Elk Creek
- Augusta Plan at Maple View - Maple View Elk Creek
- Charleston Plan at Maple View - Maple View Elk Creek
- Austin Plan at Maple View - Maple View Elk Creek
- Madison Plan at Maple View - Maple View Elk Creek
- Kingston Plan at Maple View - Maple View Elk Creek
- Abbott Plan at Maple View - Maple View Elk Creek
- 540 Chatham Place
- Charleston II Plan at Maple View
- Bayview I Plan at Maple View
- 601 Windsor Ct
- 603 Windsor Ct Unit 4618
- 603 Windsor Ct
- 527 Holland Dr Unit 4620
- 527 Holland Dr
- 605 Windsor Ct Unit 4617
- 605 Windsor Ct
- 524 Holland Dr
- 522 Holland Dr
- 542 Holland Dr
- 600 Windsor Ct Unit 4608
- 526 Holland Dr
- 520 Holland Dr
- 602 Windsor Ct Unit 4609
- 403 Sudbury Dr
- 401 Sudbury Dr
- 607 Windsor Ct Unit 4616
- 604 Windsor Ct
- 405 Sudbury Dr Unit 4623
- 518 Holland Dr