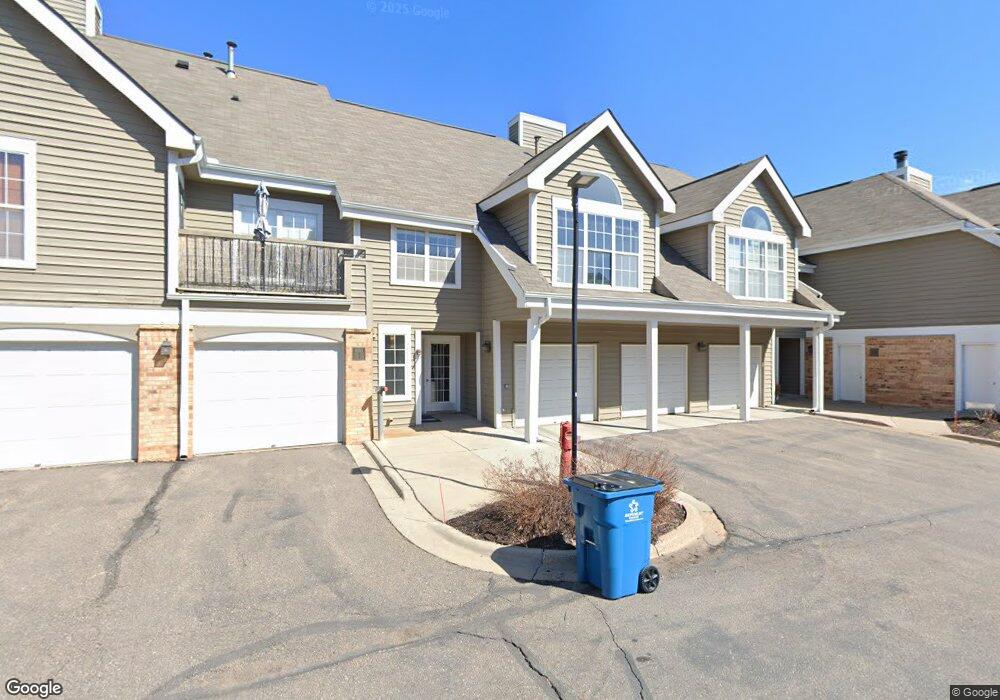
6010 Chasewood Pkwy Unit 103 Hopkins, MN 55343
Estimated Value: $220,786 - $260,000
2
Beds
2
Baths
1,096
Sq Ft
$217/Sq Ft
Est. Value
About This Home
This home is located at 6010 Chasewood Pkwy Unit 103, Hopkins, MN 55343 and is currently estimated at $237,447, approximately $216 per square foot. 6010 Chasewood Pkwy Unit 103 is a home located in Hennepin County with nearby schools including Gatewood Elementary School, Hopkins West Junior High School, and Hopkins Senior High School.
Ownership History
Date
Name
Owned For
Owner Type
Purchase Details
Closed on
Nov 4, 2019
Sold by
Marty Joyce A
Bought by
Marty Peter M
Current Estimated Value
Purchase Details
Closed on
Nov 19, 2010
Sold by
Eaton Kelly and Eaton Daniel
Bought by
Marty John O and Marty Joyce A
Purchase Details
Closed on
Jun 8, 2006
Sold by
Chasewood Development Lllp
Bought by
Sevren Kelly L
Create a Home Valuation Report for This Property
The Home Valuation Report is an in-depth analysis detailing your home's value as well as a comparison with similar homes in the area
Home Values in the Area
Average Home Value in this Area
Purchase History
| Date | Buyer | Sale Price | Title Company |
|---|---|---|---|
| Marty Peter M | $500 | None Listed On Document | |
| Marty John O | $115,000 | -- | |
| Sevren Kelly L | $206,220 | -- |
Source: Public Records
Tax History Compared to Growth
Tax History
| Year | Tax Paid | Tax Assessment Tax Assessment Total Assessment is a certain percentage of the fair market value that is determined by local assessors to be the total taxable value of land and additions on the property. | Land | Improvement |
|---|---|---|---|---|
| 2024 | $2,694 | $241,600 | $49,000 | $192,600 |
| 2023 | $2,663 | $239,400 | $49,000 | $190,400 |
| 2022 | $2,310 | $223,500 | $49,000 | $174,500 |
| 2021 | $2,283 | $201,000 | $45,000 | $156,000 |
| 2020 | $2,296 | $201,000 | $45,000 | $156,000 |
| 2019 | $2,090 | $192,900 | $45,000 | $147,900 |
| 2018 | $2,064 | $179,600 | $45,000 | $134,600 |
| 2017 | $2,004 | $166,000 | $50,000 | $116,000 |
| 2016 | $2,073 | $166,600 | $50,000 | $116,600 |
| 2015 | $1,785 | $145,000 | $30,000 | $115,000 |
| 2014 | -- | $102,700 | $30,000 | $72,700 |
Source: Public Records
Map
Nearby Homes
- 6020 Chasewood Pkwy Unit 203
- 5998 Chasewood Pkwy Unit 1
- 6048 Chasewood Pkwy Unit 204
- 5954 Lone Lake Loop
- 11413 Bren Rd
- 11409 Bren Rd
- 5754 Shady Oak Rd S Unit 1
- 5742 Shady Oak Rd S Unit 7
- 5470 Rowland Rd
- 5601 Bimini Dr
- 5480 Maple Ridge Ct
- 5524 Bimini Dr
- 5427 Butternut Cir
- 5500 Rowland Rd
- 6384 Saint Johns Dr
- 6851 Beach Rd
- 1252 Trailwood S
- 5697 Green Circle Dr Unit 219
- 5038 Dominick Spur
- 1124 Trailwood S
- 6010 Chasewood Pkwy Unit 206
- 6010 Chasewood Pkwy Unit 205
- 6010 Chasewood Pkwy Unit 204
- 6010 Chasewood Pkwy Unit 203
- 6010 Chasewood Pkwy Unit 202
- 6010 Chasewood Pkwy Unit 201
- 6010 Chasewood Pkwy Unit 102
- 6010 Chasewood Pkwy Unit 101
- 6010 Chasewood Pkwy Unit 3
- 6010 Chasewood Pkwy Unit 2
- 6010 Chasewood Pkwy Unit 1
- 6010 Chasewood Pkwy
- 6010 Chasewood Pkwy Unit 203
- 6010 Chasewood Pkwy
- 6020 Chasewood Pkwy Unit 204
- 6020 Chasewood Pkwy Unit 203
- 6020 Chasewood Pkwy Unit 202
- 6020 Chasewood Pkwy Unit 201
- 6020 Chasewood Pkwy Unit 102
- 6020 Chasewood Pkwy Unit 2