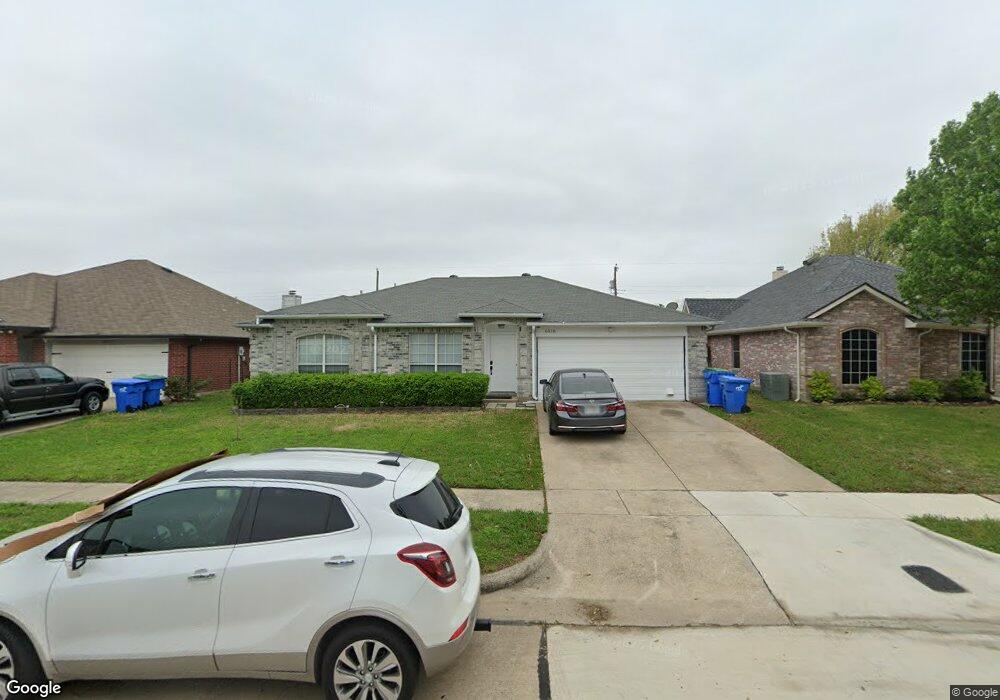
6010 Cypress Dr Rowlett, TX 75089
Springfield NeighborhoodEstimated Value: $278,921 - $314,000
3
Beds
2
Baths
1,250
Sq Ft
$236/Sq Ft
Est. Value
About This Home
This home is located at 6010 Cypress Dr, Rowlett, TX 75089 and is currently estimated at $295,480, approximately $236 per square foot. 6010 Cypress Dr is a home located in Dallas County with nearby schools including Harmony School of Innovation - Garland, Wesleyan Christian Academy, and Lake Cities Montessori School.
Ownership History
Date
Name
Owned For
Owner Type
Purchase Details
Closed on
Sep 30, 2019
Sold by
Hohenberger Dorothy P
Bought by
Johnson Jeffrey P
Current Estimated Value
Purchase Details
Closed on
Jun 28, 1995
Sold by
United Homecraft Corp
Bought by
Roberts Steven M and Roberts Sherrie
Home Financials for this Owner
Home Financials are based on the most recent Mortgage that was taken out on this home.
Original Mortgage
$72,471
Interest Rate
7.79%
Mortgage Type
Assumption
Purchase Details
Closed on
Mar 28, 1995
Sold by
Spanish Peaks Ranch Inc
Bought by
United Homecraft Corp
Home Financials for this Owner
Home Financials are based on the most recent Mortgage that was taken out on this home.
Original Mortgage
$54,878
Interest Rate
8.66%
Mortgage Type
Construction
Create a Home Valuation Report for This Property
The Home Valuation Report is an in-depth analysis detailing your home's value as well as a comparison with similar homes in the area
Home Values in the Area
Average Home Value in this Area
Purchase History
| Date | Buyer | Sale Price | Title Company |
|---|---|---|---|
| Johnson Jeffrey P | -- | Reunion Title | |
| Roberts Steven M | -- | -- | |
| United Homecraft Corp | -- | -- |
Source: Public Records
Mortgage History
| Date | Status | Borrower | Loan Amount |
|---|---|---|---|
| Previous Owner | Roberts Steven M | $72,471 | |
| Previous Owner | United Homecraft Corp | $54,878 |
Source: Public Records
Tax History Compared to Growth
Tax History
| Year | Tax Paid | Tax Assessment Tax Assessment Total Assessment is a certain percentage of the fair market value that is determined by local assessors to be the total taxable value of land and additions on the property. | Land | Improvement |
|---|---|---|---|---|
| 2025 | $4,504 | $288,240 | $70,000 | $218,240 |
| 2024 | $4,504 | $288,240 | $70,000 | $218,240 |
| 2023 | $4,504 | $243,200 | $70,000 | $173,200 |
| 2022 | $5,893 | $243,200 | $70,000 | $173,200 |
| 2021 | $4,895 | $187,000 | $50,000 | $137,000 |
| 2020 | $4,939 | $187,000 | $50,000 | $137,000 |
| 2019 | $5,374 | $187,000 | $50,000 | $137,000 |
| 2018 | $4,104 | $141,820 | $30,000 | $111,820 |
| 2017 | $4,115 | $141,820 | $30,000 | $111,820 |
| 2016 | $4,115 | $141,820 | $30,000 | $111,820 |
| 2015 | $2,774 | $123,060 | $22,500 | $100,560 |
| 2014 | $2,774 | $102,570 | $22,500 | $80,070 |
Source: Public Records
Map
Nearby Homes
- 6317 Locust St
- 6407 Redwood Ln
- 2221 Petunia Ln
- 2314 Marigold Dr
- 5905 Cedar Ln
- 5516 Maple Ln
- 6718 Livingstone St
- 6617 Stamps St
- 6306 Debbie Cir
- 5909 Brookline Dr
- 6110 Tacoma St
- 3422 Jonquil Ln
- 6913 Brandford Rd
- 5806 Beacon Dr
- 2601 Daisy Ln
- 3405 Tulip Ln
- 1501 Patty Cir
- 7013 Tremont Ln
- 7005 Buckhorn Dr
- 3412 Aster Ln
- 6006 Cypress Dr
- 6014 Cypress Dr
- 6002 Cypress Dr
- 6018 Cypress Dr
- 6013 Cypress Dr
- 6009 Cypress Dr
- 5918 Cypress Dr
- 6102 Cypress Dr
- 6017 Cypress Dr
- 6005 Cypress Dr
- 6101 Cypress Dr
- 6001 Cypress Dr
- 5914 Cypress Dr
- 6106 Cypress Dr
- 6105 Cypress Dr
- 5917 Cypress Dr
- 6012 Maple Ln
- 6008 Maple Ln
- 6016 Maple Ln
- 6004 Maple Ln