Estimated Value: $212,000 - $270,000
2
Beds
2
Baths
912
Sq Ft
$254/Sq Ft
Est. Value
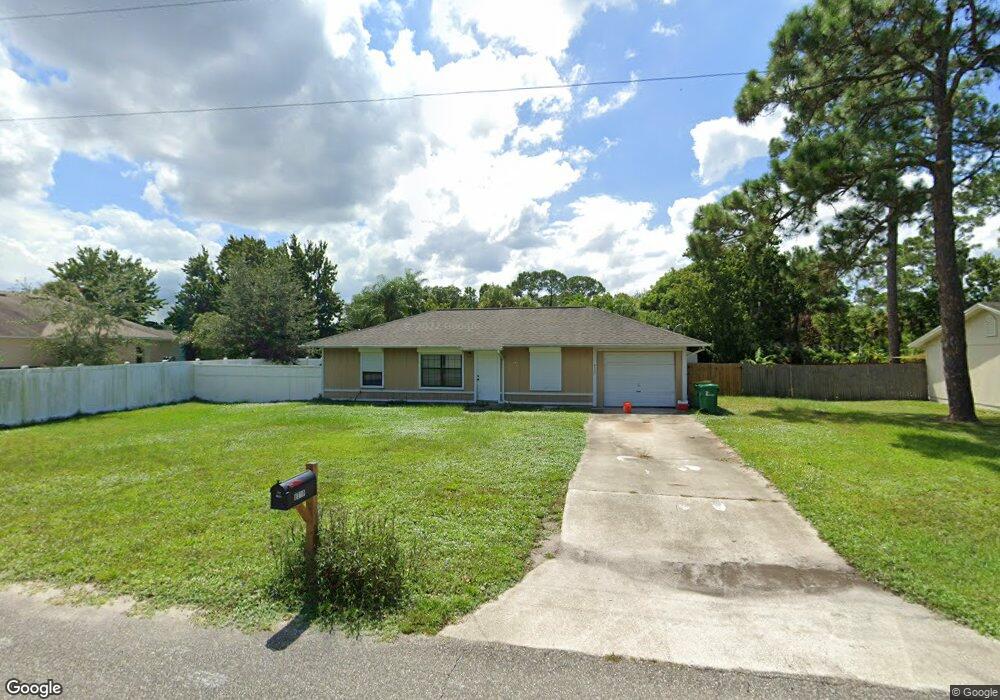
About This Home
This home is located at 6010 Elgin Rd, Cocoa, FL 32927 and is currently estimated at $231,904, approximately $254 per square foot. 6010 Elgin Rd is a home located in Brevard County with nearby schools including Challenger 7 Elementary School, Space Coast Junior/Senior High School, and East Atlantic Prep of Brevard County.
Ownership History
Date
Name
Owned For
Owner Type
Purchase Details
Closed on
Sep 20, 2010
Sold by
Bowen Lisa
Bought by
Minacapelli Leonard
Current Estimated Value
Purchase Details
Closed on
Sep 29, 2005
Sold by
Warren Frank C and Warren Georgia M
Bought by
Bowen Lisa A
Home Financials for this Owner
Home Financials are based on the most recent Mortgage that was taken out on this home.
Original Mortgage
$123,920
Interest Rate
5.72%
Purchase Details
Closed on
Dec 29, 1998
Sold by
Dept Housing & Urban Dev
Bought by
Warren Frank C and Warren Georgia M
Purchase Details
Closed on
Oct 5, 1998
Sold by
Morgan Ronald B and Morgan Eileen M
Bought by
Housing & Urban Dev
Purchase Details
Closed on
May 19, 1997
Sold by
Brown Scott A and Brown Tammy L
Bought by
Morgan Ronald B and Morgan Eileen M
Home Financials for this Owner
Home Financials are based on the most recent Mortgage that was taken out on this home.
Original Mortgage
$54,871
Interest Rate
8.17%
Create a Home Valuation Report for This Property
The Home Valuation Report is an in-depth analysis detailing your home's value as well as a comparison with similar homes in the area
Home Values in the Area
Average Home Value in this Area
Purchase History
| Date | Buyer | Sale Price | Title Company |
|---|---|---|---|
| Minacapelli Leonard | $45,000 | Federal Title Ins Agency Inc | |
| Bowen Lisa A | $154,900 | Fidelity Natl Title Ins Co | |
| Warren Frank C | $45,100 | -- | |
| Housing & Urban Dev | $54,600 | -- | |
| Morgan Ronald B | $54,900 | -- |
Source: Public Records
Mortgage History
| Date | Status | Borrower | Loan Amount |
|---|---|---|---|
| Previous Owner | Bowen Lisa A | $123,920 | |
| Previous Owner | Morgan Ronald B | $54,871 |
Source: Public Records
Tax History
| Year | Tax Paid | Tax Assessment Tax Assessment Total Assessment is a certain percentage of the fair market value that is determined by local assessors to be the total taxable value of land and additions on the property. | Land | Improvement |
|---|---|---|---|---|
| 2025 | $2,133 | $154,080 | -- | -- |
| 2024 | $2,134 | $156,920 | -- | -- |
| 2023 | $2,134 | $162,900 | $0 | $0 |
| 2022 | $1,837 | $140,120 | $0 | $0 |
| 2021 | $1,636 | $101,030 | $42,000 | $59,030 |
| 2020 | $1,514 | $91,170 | $40,000 | $51,170 |
| 2019 | $1,417 | $87,300 | $35,000 | $52,300 |
| 2018 | $1,336 | $77,430 | $27,000 | $50,430 |
| 2017 | $1,264 | $68,060 | $24,000 | $44,060 |
| 2016 | $1,184 | $57,470 | $18,000 | $39,470 |
| 2015 | $1,123 | $43,400 | $15,000 | $28,400 |
| 2014 | $1,033 | $39,460 | $11,000 | $28,460 |
Source: Public Records
Map
Nearby Homes
- 6020 Cannon Ave
- 5950 Ackard Ave
- 5945 Coker Ave
- 5221 Carrick Rd
- 5946 Deer Ln
- 6094 Cardiff Ave
- 5215 Holden Rd
- 5220 Holden Rd
- 5914 Stillwater Ave
- 4975 Fay Blvd
- 4905 Bridge Rd
- 6210 Stillwater Ave
- 6375 Cable Ave
- 6438 Hudson Rd
- 5265 Fay Blvd
- 6450 Ember Ave
- 5720 Flint Rd
- 00 Unknown
- 6310 Depot Ave
- 5680 Banos Ave
- 6020 Elgin Rd
- 5240 Sanbourne St
- 5250 Sanbourne St
- 6015 Elgin Rd
- 6030 Elgin Rd
- 6005 Elgin Rd
- 6023 Elgin Rd
- 5260 Sanbourne St
- 6031 Elgin Rd
- 5210 Sanbourne St
- 5270 Sanbourne St
- 5241 Sanbourne St
- 6050 Elgin Rd
- 5231 Sanbourne St
- 5960 Cannon Ave
- 5251 Sanbourne St
- 6039 Elgin Rd
- 6060 Elgin Rd
- 5200 Sanbourne St
- 5261 Sanbourne St
Your Personal Tour Guide
Ask me questions while you tour the home.