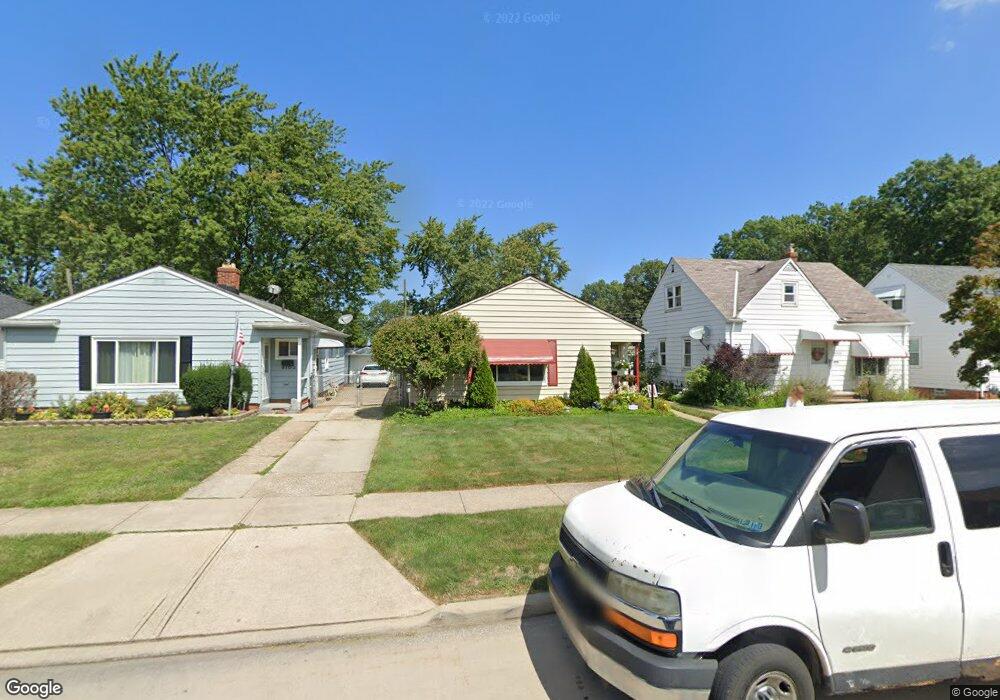
6010 Ridgewood Ave Cleveland, OH 44129
Estimated Value: $162,000 - $197,000
2
Beds
1
Bath
1,048
Sq Ft
$167/Sq Ft
Est. Value
About This Home
This home is located at 6010 Ridgewood Ave, Cleveland, OH 44129 and is currently estimated at $175,049, approximately $167 per square foot. 6010 Ridgewood Ave is a home located in Cuyahoga County with nearby schools including Thoreau Park Elementary School, Shiloh Middle School, and Parma High School.
Ownership History
Date
Name
Owned For
Owner Type
Purchase Details
Closed on
May 3, 2002
Sold by
Davis Louis L and Davis Laurel B
Bought by
Potts Jason M
Current Estimated Value
Home Financials for this Owner
Home Financials are based on the most recent Mortgage that was taken out on this home.
Original Mortgage
$99,800
Outstanding Balance
$42,882
Interest Rate
7.18%
Estimated Equity
$132,167
Purchase Details
Closed on
May 26, 1992
Sold by
Aborub Sam A
Bought by
Davis Louis L
Purchase Details
Closed on
Nov 5, 1987
Sold by
Mckenzie Dennis J
Bought by
Aborub Sam A
Purchase Details
Closed on
Aug 27, 1985
Sold by
Mckenzie Dennis J and Mckenzie Deborah
Bought by
Mckenzie Dennis J
Purchase Details
Closed on
Jan 5, 1983
Sold by
Gray Lawrence P
Bought by
Mckenzie Dennis J and Mckenzie Deborah
Purchase Details
Closed on
Mar 21, 1978
Sold by
Koncsni Irene
Bought by
Gray Lawrence P
Purchase Details
Closed on
Jan 1, 1975
Bought by
Koncsni Irene
Create a Home Valuation Report for This Property
The Home Valuation Report is an in-depth analysis detailing your home's value as well as a comparison with similar homes in the area
Home Values in the Area
Average Home Value in this Area
Purchase History
| Date | Buyer | Sale Price | Title Company |
|---|---|---|---|
| Potts Jason M | $102,900 | Suntrust Title | |
| Davis Louis L | $64,000 | -- | |
| Aborub Sam A | $42,000 | -- | |
| Mckenzie Dennis J | -- | -- | |
| Mckenzie Dennis J | $43,500 | -- | |
| Gray Lawrence P | $39,000 | -- | |
| Koncsni Irene | -- | -- |
Source: Public Records
Mortgage History
| Date | Status | Borrower | Loan Amount |
|---|---|---|---|
| Open | Potts Jason M | $99,800 |
Source: Public Records
Tax History Compared to Growth
Tax History
| Year | Tax Paid | Tax Assessment Tax Assessment Total Assessment is a certain percentage of the fair market value that is determined by local assessors to be the total taxable value of land and additions on the property. | Land | Improvement |
|---|---|---|---|---|
| 2024 | $3,019 | $48,755 | $9,940 | $38,815 |
| 2023 | $2,839 | $39,620 | $8,190 | $31,430 |
| 2022 | $2,811 | $39,620 | $8,190 | $31,430 |
| 2021 | $2,891 | $39,620 | $8,190 | $31,430 |
| 2020 | $2,535 | $30,490 | $6,300 | $24,190 |
| 2019 | $2,424 | $87,100 | $18,000 | $69,100 |
| 2018 | $2,439 | $30,490 | $6,300 | $24,190 |
| 2017 | $2,348 | $27,370 | $5,250 | $22,120 |
| 2016 | $2,333 | $27,370 | $5,250 | $22,120 |
| 2015 | $2,222 | $27,370 | $5,250 | $22,120 |
| 2014 | $2,222 | $27,940 | $5,360 | $22,580 |
Source: Public Records
Map
Nearby Homes
- 6011 Theota Ave
- 5815 Westlake Ave
- 6606 Theota Ave
- 5914 Forest Ave
- 5618 Bradley Ave
- 6215 Forest Ave
- 6014 Laverne Ave
- 5810 Laverne Ave
- 6306 Gilbert Ave
- 6211 Luelda Ave
- 5212 Wood Ave
- 6711 Forest Ave
- 5000 Torrington Ave
- 6903 Forest Ave
- 6403 Kenneth Ave
- 5511 Velma Ave
- 5906 Velma Ave
- 4910 Russell Ave
- 4915 Tuxedo Ave
- 4911 Tuxedo Ave
- 6102 Ridgewood Ave
- 6006 Ridgewood Ave
- 6106 Ridgewood Ave
- 6002 Ridgewood Ave
- 6110 Ridgewood Ave
- 6202 Ridgewood Ave
- 6011 Ridgewood Ave
- 5914 Ridgewood Ave
- 6103 Ridgewood Ave
- 6007 Ridgewood Ave
- 6107 Ridgewood Ave
- 6003 Ridgewood Ave
- 6206 Ridgewood Ave
- 6111 Ridgewood Ave
- 5910 Ridgewood Ave
- 6205 Ridgewood Ave
- 6210 Ridgewood Ave
- 5915 Ridgewood Ave
- 5906 Ridgewood Ave
- 6207 Ridgewood Ave