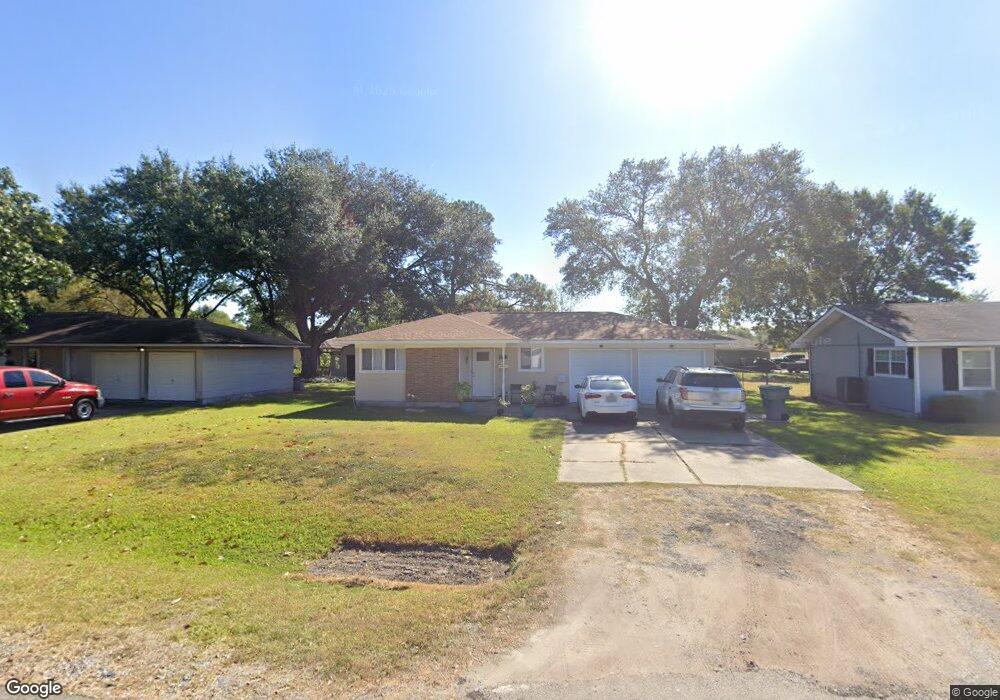
6012 16th St Port Arthur, TX 77642
Estimated Value: $137,000 - $159,000
--
Bed
--
Bath
1,327
Sq Ft
$111/Sq Ft
Est. Value
About This Home
This home is located at 6012 16th St, Port Arthur, TX 77642 and is currently estimated at $146,898, approximately $110 per square foot. 6012 16th St is a home located in Jefferson County with nearby schools including Travis Elementary School, Jefferson Middle School, and Memorial High School.
Ownership History
Date
Name
Owned For
Owner Type
Purchase Details
Closed on
May 20, 2025
Sold by
Aguilar Sergio and Aguilar Sandra
Bought by
Nunez Maria
Current Estimated Value
Purchase Details
Closed on
Dec 1, 2020
Sold by
Vannguyen Dong Van
Bought by
Vannguyen Tai Van
Purchase Details
Closed on
Jan 30, 2006
Sold by
Haley Sarah A
Bought by
Vannguyen Dong
Home Financials for this Owner
Home Financials are based on the most recent Mortgage that was taken out on this home.
Original Mortgage
$31,500
Interest Rate
5.74%
Mortgage Type
Fannie Mae Freddie Mac
Create a Home Valuation Report for This Property
The Home Valuation Report is an in-depth analysis detailing your home's value as well as a comparison with similar homes in the area
Home Values in the Area
Average Home Value in this Area
Purchase History
| Date | Buyer | Sale Price | Title Company |
|---|---|---|---|
| Nunez Maria | -- | Corporation Service | |
| Vannguyen Tai Van | -- | None Available | |
| Vannguyen Dong | -- | None Available |
Source: Public Records
Mortgage History
| Date | Status | Borrower | Loan Amount |
|---|---|---|---|
| Previous Owner | Vannguyen Dong | $31,500 |
Source: Public Records
Tax History Compared to Growth
Tax History
| Year | Tax Paid | Tax Assessment Tax Assessment Total Assessment is a certain percentage of the fair market value that is determined by local assessors to be the total taxable value of land and additions on the property. | Land | Improvement |
|---|---|---|---|---|
| 2025 | $3,876 | $138,674 | $9,000 | $129,674 |
| 2024 | $3,876 | $135,314 | $5,640 | $129,674 |
| 2023 | $3,876 | $135,314 | $5,640 | $129,674 |
| 2022 | $4,023 | $126,669 | $5,640 | $121,029 |
| 2021 | $3,195 | $96,411 | $5,640 | $90,771 |
| 2020 | $1,569 | $48,409 | $5,640 | $42,769 |
| 2019 | $93 | $45,900 | $5,640 | $40,260 |
| 2018 | $117 | $49,720 | $5,640 | $44,080 |
| 2017 | $117 | $49,720 | $5,640 | $44,080 |
| 2016 | $1,456 | $49,720 | $5,640 | $44,080 |
| 2015 | $1,046 | $46,970 | $5,640 | $41,330 |
| 2014 | $1,046 | $46,970 | $5,640 | $41,330 |
Source: Public Records
Map
Nearby Homes