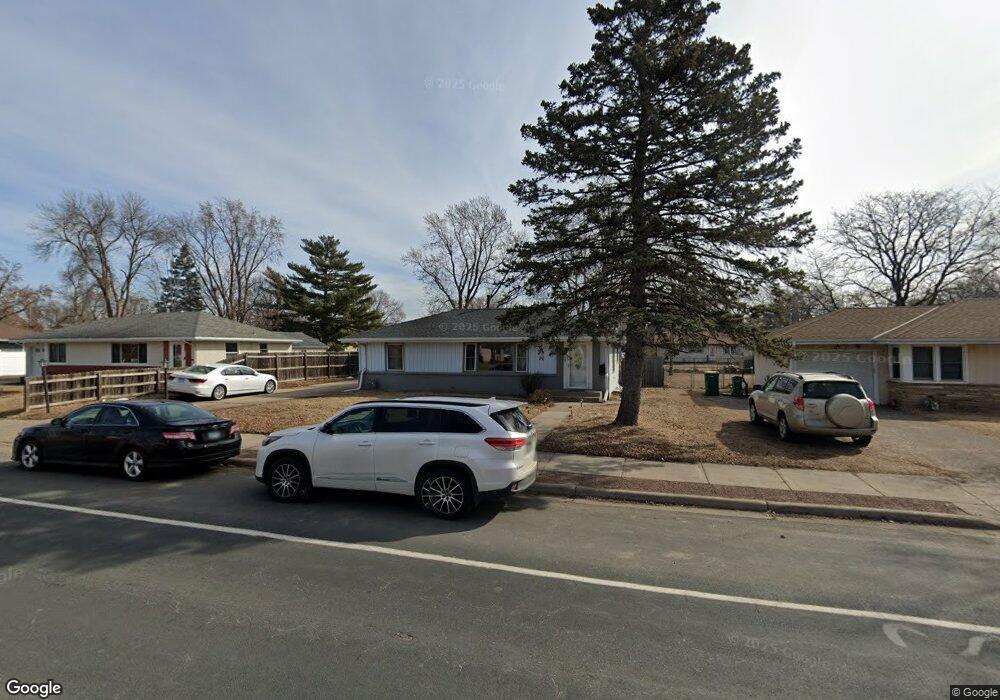
6012 Dupont Ave N Minneapolis, MN 55430
Grandview NeighborhoodEstimated Value: $298,000 - $317,000
3
Beds
2
Baths
1,770
Sq Ft
$173/Sq Ft
Est. Value
About This Home
This home is located at 6012 Dupont Ave N, Minneapolis, MN 55430 and is currently estimated at $306,861, approximately $173 per square foot. 6012 Dupont Ave N is a home located in Hennepin County with nearby schools including Brooklyn Center Elementary STEAM, Bright Water MontessoriSchool, and KIPP North Star Primary.
Ownership History
Date
Name
Owned For
Owner Type
Purchase Details
Closed on
Apr 29, 2022
Sold by
Lee Dexter
Bought by
Xiong Toua
Current Estimated Value
Home Financials for this Owner
Home Financials are based on the most recent Mortgage that was taken out on this home.
Original Mortgage
$269,250
Outstanding Balance
$253,104
Interest Rate
4.16%
Mortgage Type
New Conventional
Estimated Equity
$53,757
Purchase Details
Closed on
Apr 27, 2022
Sold by
Dexter Lee
Bought by
Xiong Toua
Home Financials for this Owner
Home Financials are based on the most recent Mortgage that was taken out on this home.
Original Mortgage
$269,250
Outstanding Balance
$253,104
Interest Rate
4.16%
Mortgage Type
New Conventional
Estimated Equity
$53,757
Purchase Details
Closed on
Aug 20, 2018
Sold by
Barbosa Abraham S and Barbosa Melissa
Bought by
Lee Dexter
Home Financials for this Owner
Home Financials are based on the most recent Mortgage that was taken out on this home.
Original Mortgage
$209,900
Interest Rate
4.5%
Mortgage Type
VA
Purchase Details
Closed on
Jun 13, 2018
Sold by
Lakeview Loan Servicing Llc
Bought by
The Secretary Of Veterans Affairs
Purchase Details
Closed on
Mar 27, 2018
Sold by
Newton Abraham S
Bought by
Laeview Laon Servicing Llc
Purchase Details
Closed on
Dec 14, 2010
Sold by
Myhomesource Llc
Bought by
Newton Abraham S
Purchase Details
Closed on
Mar 19, 2010
Sold by
Greater Metropolitan Housing Corp
Bought by
Myhomesource Llc
Purchase Details
Closed on
Jun 4, 2009
Sold by
Wilmington Trust Company
Bought by
Greater Metropolitan Housing Corporation
Purchase Details
Closed on
Feb 10, 2005
Sold by
Olvera Luis A
Bought by
Reyes Marie A
Home Financials for this Owner
Home Financials are based on the most recent Mortgage that was taken out on this home.
Original Mortgage
$149,000
Interest Rate
5.7%
Mortgage Type
Land Contract Argmt. Of Sale
Purchase Details
Closed on
Oct 18, 2004
Sold by
Mock Frank L and Mock Gloria J
Bought by
Olvera Luis A
Create a Home Valuation Report for This Property
The Home Valuation Report is an in-depth analysis detailing your home's value as well as a comparison with similar homes in the area
Home Values in the Area
Average Home Value in this Area
Purchase History
| Date | Buyer | Sale Price | Title Company |
|---|---|---|---|
| Xiong Toua | $285,000 | -- | |
| Xiong Toua | $285,000 | Titlesmart | |
| Lee Dexter | $209,900 | Executive Title | |
| The Secretary Of Veterans Affairs | -- | Servicelink | |
| Laeview Laon Servicing Llc | -- | None Available | |
| Newton Abraham S | $127,000 | -- | |
| Myhomesource Llc | $65,000 | -- | |
| Greater Metropolitan Housing Corporation | $60,000 | -- | |
| Reyes Marie A | $169,000 | -- | |
| Olvera Luis A | $152,000 | -- |
Source: Public Records
Mortgage History
| Date | Status | Borrower | Loan Amount |
|---|---|---|---|
| Open | Xiong Toua | $269,250 | |
| Closed | Xiong Toua | $270,750 | |
| Previous Owner | Lee Dexter | $209,900 | |
| Previous Owner | Reyes Marie A | $149,000 |
Source: Public Records
Tax History Compared to Growth
Tax History
| Year | Tax Paid | Tax Assessment Tax Assessment Total Assessment is a certain percentage of the fair market value that is determined by local assessors to be the total taxable value of land and additions on the property. | Land | Improvement |
|---|---|---|---|---|
| 2024 | $4,133 | $272,300 | $64,000 | $208,300 |
| 2023 | $4,327 | $276,700 | $65,000 | $211,700 |
| 2022 | $0 | $278,000 | $76,000 | $202,000 |
| 2021 | $2,639 | $234,000 | $62,000 | $172,000 |
| 2020 | $2,639 | $222,000 | $56,000 | $166,000 |
| 2019 | $2,639 | $209,000 | $50,000 | $159,000 |
| 2018 | $2,639 | $180,000 | $42,000 | $138,000 |
| 2017 | $2,142 | $143,000 | $33,000 | $110,000 |
| 2016 | $2,272 | $138,000 | $38,000 | $100,000 |
| 2015 | $1,925 | $124,800 | $34,100 | $90,700 |
| 2014 | -- | $110,500 | $32,600 | $77,900 |
Source: Public Records
Map
Nearby Homes
- 6006 Bryant Ave N
- 5818 Emerson Ave N
- 5929 Camden Ave N
- 6518 W River Rd
- 810 57th Ave N
- 1107 57th Ave N
- 5654 Bryant Ave N
- 5716 James Ave N
- 5819 Knox Ave N
- 6342 Girard Ave N
- 5527 Fremont Ave N
- 5513 Bryant Ave N
- 5524 Humboldt Ave N
- 5447 N 4th St
- 2017 Brookview Dr
- 6542 Riverwood Ln
- 5238 Fremont Ave N
- 5239 N 6th St
- 2212 55th Ave N
- 6733 Emerson Ave N
- 6006 Dupont Ave N
- 6018 Dupont Ave N
- 6013 Colfax Ave N
- 6007 Colfax Ave N
- 6024 Dupont Ave N
- 6000 Dupont Ave N
- 6019 Colfax Ave N
- 6001 Colfax Ave N
- 6015 Dupont Ave N
- 6025 Colfax Ave N
- 6023 Dupont Ave N
- 6007 Dupont Ave N
- 6030 Dupont Ave N
- 6029 Dupont Ave N
- 6001 Dupont Ave N
- 6031 Colfax Ave N
- 5942 Dupont Ave N
- 6035 Dupont Ave N
- 6036 Dupont Ave N
- 5943 Colfax Ave N