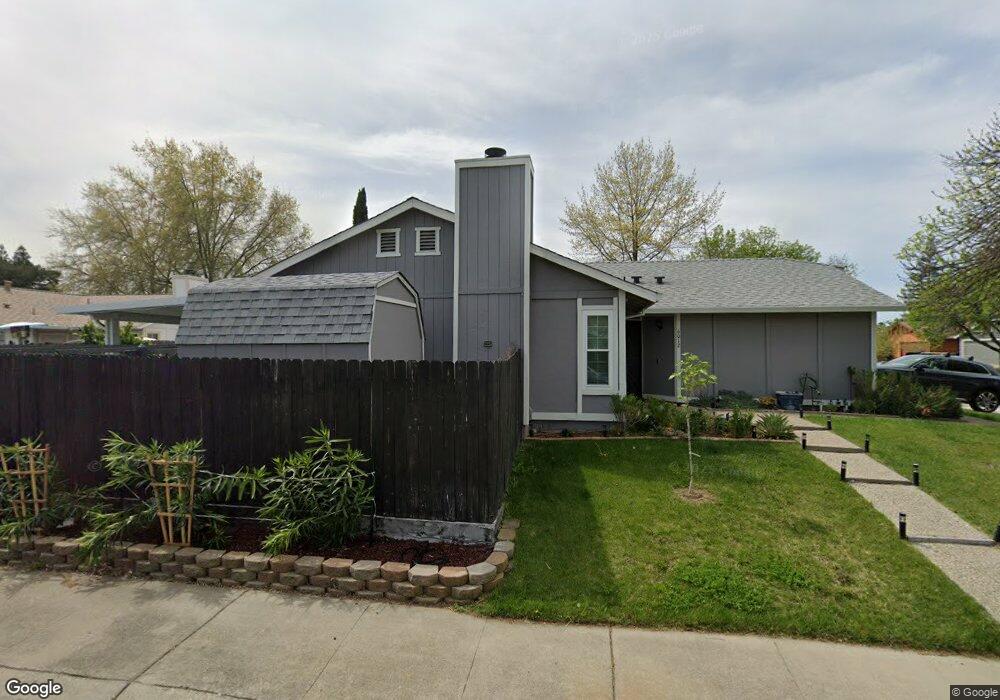
6012 Landing Point Way Sacramento, CA 95823
North Laguna NeighborhoodEstimated Value: $333,000 - $459,000
3
Beds
2
Baths
1,341
Sq Ft
$318/Sq Ft
Est. Value
About This Home
This home is located at 6012 Landing Point Way, Sacramento, CA 95823 and is currently estimated at $426,330, approximately $317 per square foot. 6012 Landing Point Way is a home located in Sacramento County with nearby schools including Barbara Comstock Morse Elementary School, Edward Harris Jr. Middle School, and Monterey Trail High School.
Ownership History
Date
Name
Owned For
Owner Type
Purchase Details
Closed on
Nov 6, 2009
Sold by
Federal National Mortgage Association
Bought by
Malone Shaun and Malone Zarina
Current Estimated Value
Home Financials for this Owner
Home Financials are based on the most recent Mortgage that was taken out on this home.
Original Mortgage
$152,192
Interest Rate
4.97%
Mortgage Type
FHA
Purchase Details
Closed on
Sep 4, 2009
Sold by
Rojas Hugo and Rojas Daysi
Bought by
Federal National Mortgage Association
Purchase Details
Closed on
Sep 13, 2006
Sold by
Rojas Hugo and Rojas Daysi
Bought by
Rojas Hugo and Rojas Daysi
Purchase Details
Closed on
Sep 8, 2005
Sold by
Perez David and Estate Of Lupe Perez
Bought by
Rojas Hugo and Rojas Daysi
Home Financials for this Owner
Home Financials are based on the most recent Mortgage that was taken out on this home.
Original Mortgage
$264,000
Interest Rate
1.37%
Mortgage Type
Negative Amortization
Create a Home Valuation Report for This Property
The Home Valuation Report is an in-depth analysis detailing your home's value as well as a comparison with similar homes in the area
Home Values in the Area
Average Home Value in this Area
Purchase History
| Date | Buyer | Sale Price | Title Company |
|---|---|---|---|
| Malone Shaun | $157,000 | Stewart Title Of California | |
| Federal National Mortgage Association | $307,255 | Landsafe Title | |
| Rojas Hugo | -- | None Available | |
| Rojas Hugo | $330,000 | Chicago Title Co |
Source: Public Records
Mortgage History
| Date | Status | Borrower | Loan Amount |
|---|---|---|---|
| Previous Owner | Malone Shaun | $152,192 | |
| Previous Owner | Rojas Hugo | $264,000 |
Source: Public Records
Tax History Compared to Growth
Tax History
| Year | Tax Paid | Tax Assessment Tax Assessment Total Assessment is a certain percentage of the fair market value that is determined by local assessors to be the total taxable value of land and additions on the property. | Land | Improvement |
|---|---|---|---|---|
| 2025 | $4,088 | $207,761 | $58,078 | $149,683 |
| 2024 | $4,088 | $203,689 | $56,940 | $146,749 |
| 2023 | $2,456 | $199,696 | $55,824 | $143,872 |
| 2022 | $2,427 | $195,781 | $54,730 | $141,051 |
| 2021 | $2,387 | $191,943 | $53,657 | $138,286 |
| 2020 | $4,760 | $189,976 | $53,107 | $136,869 |
| 2019 | $7,841 | $186,252 | $52,066 | $134,186 |
| 2018 | $7,503 | $182,601 | $51,046 | $131,555 |
| 2017 | $2,151 | $174,610 | $50,046 | $124,564 |
| 2016 | $2,055 | $171,187 | $49,065 | $122,122 |
| 2015 | $2,314 | $168,616 | $48,328 | $120,288 |
| 2014 | $3,954 | $165,314 | $47,382 | $117,932 |
Source: Public Records
Map
Nearby Homes
- 5 Suncloud Ct
- 6279 Dayspring Way
- 8450 Montpelier Way
- 6424 Ventris Walk
- 8647 Starburst Way
- 6441 Ventris Walk
- Danville Plan at Ventris Place
- Carefree Plan at Ventris Place
- Biltmore Plan at Ventris Place
- Astoria Plan at Ventris Place
- 6451 Jacinto Ave
- 6427 Jacinto Ave
- 6509 Jacinto Ave
- 6419 Jacinto Ave
- 6411 Jacinto Ave
- 6517 Jacinto Ave
- 6403 Jacinto Ave
- 6325 Jacinto Ave
- 6317 Jacinto Ave
- 6131 Jacinto Ave
- 6008 Landing Point Way
- 6010 Windbreaker Way
- 6004 Landing Point Way
- 6016 Landing Point Way
- 6006 Windbreaker Way
- 6013 Landing Point Way
- 6009 Landing Point Way
- 6011 Windbreaker Way
- 8539 Carlin Ave
- 6000 Landing Point Way
- 6020 Landing Point Way
- 6005 Landing Point Way
- 6017 Landing Point Way
- 6007 Windbreaker Way
- 8543 Carlin Ave
- 6002 Windbreaker Way
- 6001 Landing Point Way
- 6024 Landing Point Way
- 6021 Landing Point Way
- 6022 Windbreaker Way