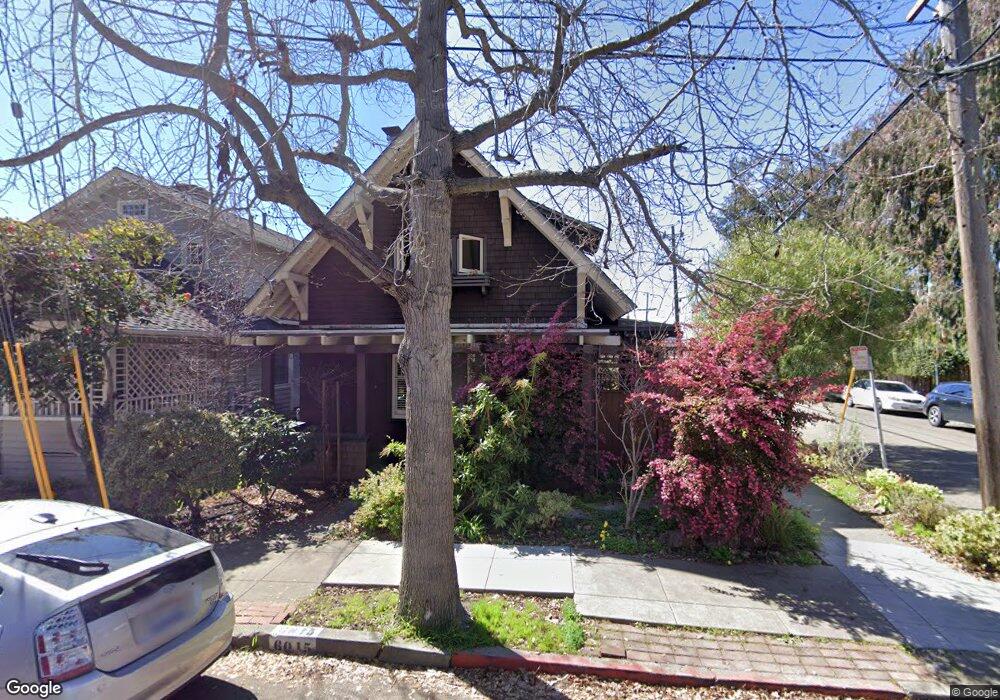
6015 Auburn Ave Oakland, CA 94618
Rockridge NeighborhoodEstimated Value: $1,369,000 - $1,648,000
3
Beds
2
Baths
1,565
Sq Ft
$987/Sq Ft
Est. Value
About This Home
This home is located at 6015 Auburn Ave, Oakland, CA 94618 and is currently estimated at $1,544,095, approximately $986 per square foot. 6015 Auburn Ave is a home located in Alameda County with nearby schools including Chabot Elementary School, Claremont Middle School, and Oakland Technical High School.
Ownership History
Date
Name
Owned For
Owner Type
Purchase Details
Closed on
Aug 5, 2024
Sold by
Movlai And Clark Family Trust and Clark Marian
Bought by
Battaglino Alexander Giles and Mcglinchey Ellen Morgan
Current Estimated Value
Home Financials for this Owner
Home Financials are based on the most recent Mortgage that was taken out on this home.
Original Mortgage
$760,000
Outstanding Balance
$740,241
Interest Rate
6.95%
Mortgage Type
New Conventional
Estimated Equity
$803,854
Purchase Details
Closed on
Jul 28, 2012
Sold by
Movlai Manocher and Clark Marian
Bought by
Clark Marian and Movlai & Clark Family Trust
Purchase Details
Closed on
Jan 20, 2006
Sold by
Movlai Manocher
Bought by
Movlai Manocher and Clark Marian
Purchase Details
Closed on
Oct 2, 2002
Sold by
Hallahan Timothy H and Hansen Ann M
Bought by
Movlai Manocher
Create a Home Valuation Report for This Property
The Home Valuation Report is an in-depth analysis detailing your home's value as well as a comparison with similar homes in the area
Home Values in the Area
Average Home Value in this Area
Purchase History
| Date | Buyer | Sale Price | Title Company |
|---|---|---|---|
| Battaglino Alexander Giles | $1,460,000 | Chicago Title | |
| Clark Marian | -- | None Available | |
| Movlai Manocher | -- | Commonwealth Land Title Co | |
| Movlai Manocher | $680,000 | Chicago Title Company | |
| Movlai Manocher | -- | Chicago Title Company |
Source: Public Records
Mortgage History
| Date | Status | Borrower | Loan Amount |
|---|---|---|---|
| Open | Battaglino Alexander Giles | $760,000 |
Source: Public Records
Tax History Compared to Growth
Tax History
| Year | Tax Paid | Tax Assessment Tax Assessment Total Assessment is a certain percentage of the fair market value that is determined by local assessors to be the total taxable value of land and additions on the property. | Land | Improvement |
|---|---|---|---|---|
| 2025 | $14,025 | $1,453,000 | $438,000 | $1,022,000 |
| 2024 | $14,025 | $965,470 | $289,641 | $675,829 |
| 2023 | $14,795 | $946,545 | $283,963 | $662,582 |
| 2022 | $14,456 | $927,988 | $278,396 | $649,592 |
| 2021 | $13,926 | $909,798 | $272,939 | $636,859 |
| 2020 | $13,802 | $900,475 | $270,142 | $630,333 |
| 2019 | $13,351 | $882,823 | $264,847 | $617,976 |
| 2018 | $13,074 | $865,517 | $259,655 | $605,862 |
| 2017 | $12,602 | $848,551 | $254,565 | $593,986 |
| 2016 | $12,252 | $831,918 | $249,575 | $582,343 |
| 2015 | $12,192 | $819,427 | $245,828 | $573,599 |
| 2014 | $12,429 | $803,378 | $241,013 | $562,365 |
Source: Public Records
Map
Nearby Homes
- 6218 Manoa St
- 309 63rd St
- 6043 Harwood Ave
- 2636 Alcatraz Ave
- 0 Ivanhoe Rd Unit 41053781
- 6108 Hillegass Ave
- 5687 Miles Ave
- 6446 Colby St
- 3021 Bateman St
- 5936 Broadway
- 6189 Margarido Dr
- 2964 Magnolia St
- 484 Forest St
- 6000 N Rockridge Blvd
- 5522 Taft Ave
- 470 62nd St
- 480 62nd St
- 2417 Webster St
- 486 Mcauley St
- 3047 Halcyon Ct
- 6013 Auburn Ave
- 46 Armanino Ct
- 6009 Auburn Ave
- 6026 Auburn Ave
- 6020 Auburn Ave
- 6007 Auburn Ave
- 36 Armanino Ct
- 6016 Auburn Ave
- 6005 Auburn Ave
- 6012 Auburn Ave
- 45 Armanino Ct
- 6312 Florio St
- 28 Armanino Ct
- 35 Armanino Ct
- 6008 Auburn Ave
- 6003 Auburn Ave
- 6321 Florio St
- 6201 Auburn Ave
- 6329 Florio St
- 29 Armanino Ct