6015 Princeton Reach Way Granite Bay, CA 95746
Estimated Value: $989,000 - $1,537,000
4
Beds
3
Baths
3,442
Sq Ft
$397/Sq Ft
Est. Value
About This Home
This home is located at 6015 Princeton Reach Way, Granite Bay, CA 95746 and is currently estimated at $1,365,398, approximately $396 per square foot. 6015 Princeton Reach Way is a home located in Placer County with nearby schools including Greenhills Elementary School, Ridgeview Elementary School, and Willma Cavitt Junior High School.
Ownership History
Date
Name
Owned For
Owner Type
Purchase Details
Closed on
Mar 11, 2013
Sold by
Caradine Joe K
Bought by
Diodati Kirk S and Wilhite Laura
Current Estimated Value
Home Financials for this Owner
Home Financials are based on the most recent Mortgage that was taken out on this home.
Original Mortgage
$450,000
Outstanding Balance
$316,833
Interest Rate
3.49%
Mortgage Type
New Conventional
Estimated Equity
$1,048,565
Purchase Details
Closed on
Aug 11, 2006
Sold by
Caradine Joe K
Bought by
Caradine Joe K
Purchase Details
Closed on
Mar 19, 1994
Sold by
Csy Investments
Bought by
Caradine Joe K and Caradine Ramona L
Home Financials for this Owner
Home Financials are based on the most recent Mortgage that was taken out on this home.
Original Mortgage
$250,000
Interest Rate
4.12%
Mortgage Type
Purchase Money Mortgage
Create a Home Valuation Report for This Property
The Home Valuation Report is an in-depth analysis detailing your home's value as well as a comparison with similar homes in the area
Home Values in the Area
Average Home Value in this Area
Purchase History
| Date | Buyer | Sale Price | Title Company |
|---|---|---|---|
| Diodati Kirk S | $785,000 | Placer Title Company | |
| Caradine Joe K | -- | None Available | |
| Caradine Joe K | $475,000 | Placer Title Co |
Source: Public Records
Mortgage History
| Date | Status | Borrower | Loan Amount |
|---|---|---|---|
| Open | Diodati Kirk S | $450,000 | |
| Previous Owner | Caradine Joe K | $250,000 |
Source: Public Records
Tax History Compared to Growth
Tax History
| Year | Tax Paid | Tax Assessment Tax Assessment Total Assessment is a certain percentage of the fair market value that is determined by local assessors to be the total taxable value of land and additions on the property. | Land | Improvement |
|---|---|---|---|---|
| 2025 | $10,021 | $966,657 | $215,493 | $751,164 |
| 2023 | $10,021 | $929,123 | $207,126 | $721,997 |
| 2022 | $9,858 | $910,906 | $203,065 | $707,841 |
| 2021 | $9,667 | $893,046 | $199,084 | $693,962 |
| 2020 | $9,646 | $883,890 | $197,043 | $686,847 |
| 2019 | $9,629 | $866,560 | $193,180 | $673,380 |
| 2018 | $9,280 | $849,570 | $189,393 | $660,177 |
| 2017 | $9,341 | $832,913 | $185,680 | $647,233 |
| 2016 | $9,126 | $816,583 | $182,040 | $634,543 |
| 2015 | $8,941 | $804,318 | $179,306 | $625,012 |
| 2014 | -- | $788,563 | $175,794 | $612,769 |
Source: Public Records
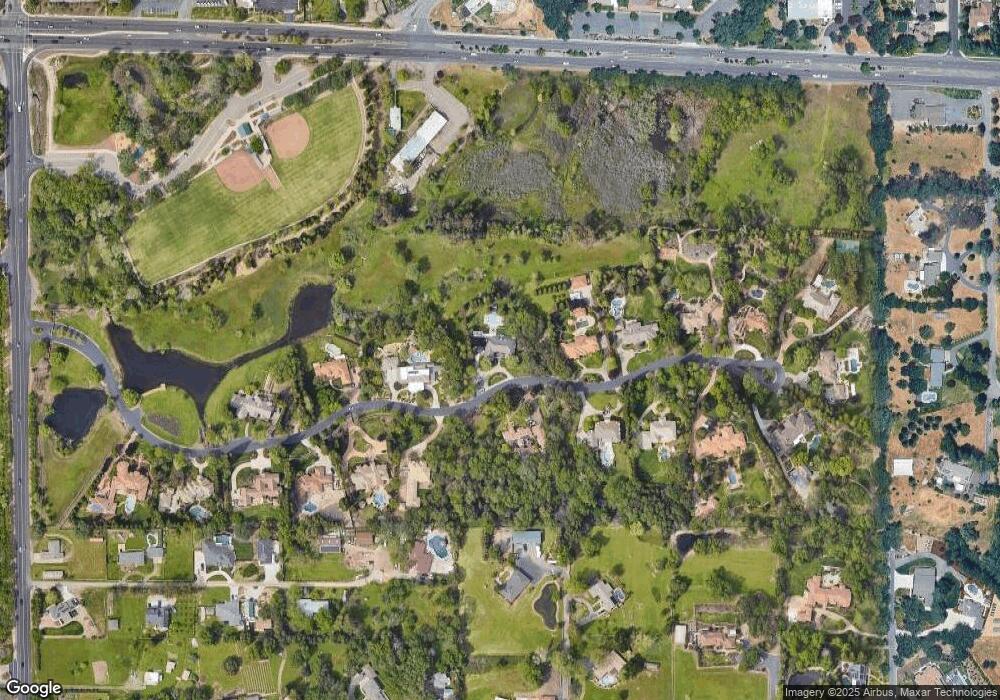
Map
Nearby Homes
- 0 Barton Rd Unit 225071726
- 8450 Dover Dr
- 6740 Eureka Rd
- 6805 Douglas Blvd Unit 75
- 6805 Douglas Blvd Unit 100
- 6805 Douglas Blvd Unit 37
- 6805 Douglas Blvd Unit 21
- 6911 Fallsbrook Ct
- Sequoia Plan at The Glen in Granite Bay
- Willow Plan at The Glen in Granite Bay
- Alder Plan at The Glen in Granite Bay
- 6739 Micherra Cir
- 6752 Micherra Cir
- 9046 Ventura St
- 9041 Ventura St
- 6766 Micherra Cir
- 8880 Auburn Folsom Rd Unit 21
- 8880 Auburn Folsom Rd Unit 48
- 8880 Auburn Folsom Rd Unit 20
- 8880 Auburn Folsom Rd Unit 29
- 6017 Princeton Reach Way
- 6013 Princeton Reach Way
- 6016 Princeton Reach Way
- 6019 Princeton Reach Way
- 6018 Princeton Reach Way
- 6014 Princeton Reach Way
- 6011 Princeton Reach Way
- 6012 Princeton Reach Way
- 6020 Princeton Reach Way
- 6021 Princeton Reach Way
- 6210 Douglas Blvd
- 6010 Princeton Reach Way
- 6225 Mica Way
- 6007 Princeton Reach Way
- 8800 Wagon Way
- 6023 Princeton Reach Way
- 6022 Princeton Reach Way
- 8801 Wagon Way
- 6008 Princeton Reach Way
- 6024 Princeton Reach Way