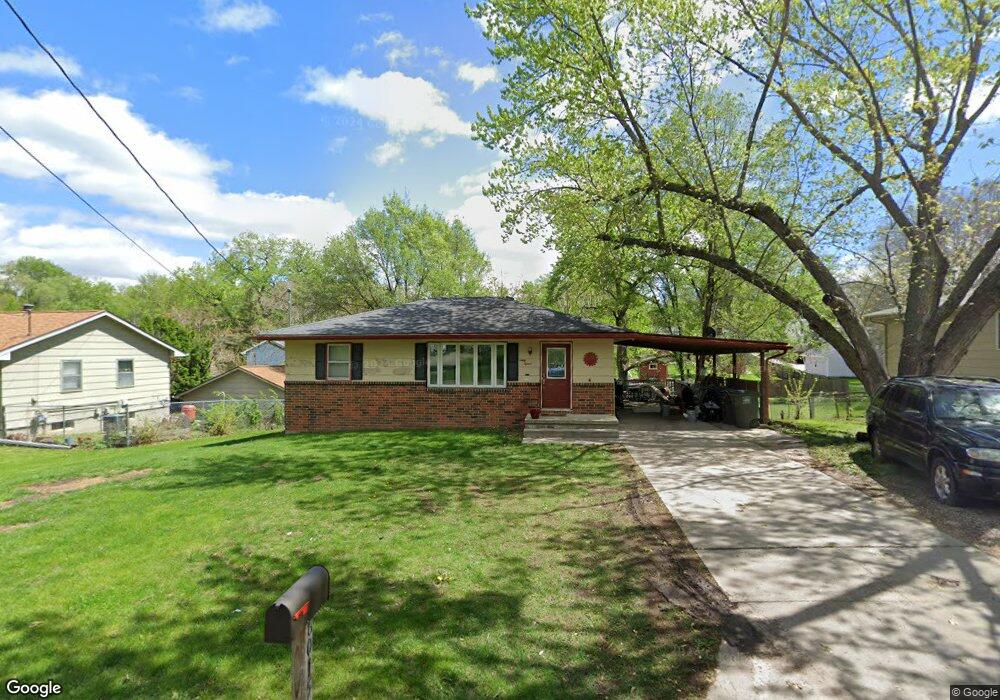
6015 SW 5th St Des Moines, IA 50315
South Central DSM NeighborhoodEstimated Value: $160,000 - $205,000
3
Beds
1
Bath
910
Sq Ft
$204/Sq Ft
Est. Value
About This Home
This home is located at 6015 SW 5th St, Des Moines, IA 50315 and is currently estimated at $185,407, approximately $203 per square foot. 6015 SW 5th St is a home located in Polk County with nearby schools including South Union Elementary School, Mccombs Middle School, and Lincoln High School.
Ownership History
Date
Name
Owned For
Owner Type
Purchase Details
Closed on
Sep 13, 2018
Sold by
Claussen Nancy
Bought by
Easton Dillan J
Current Estimated Value
Home Financials for this Owner
Home Financials are based on the most recent Mortgage that was taken out on this home.
Original Mortgage
$94,090
Outstanding Balance
$81,543
Interest Rate
4.5%
Mortgage Type
New Conventional
Estimated Equity
$103,864
Create a Home Valuation Report for This Property
The Home Valuation Report is an in-depth analysis detailing your home's value as well as a comparison with similar homes in the area
Home Values in the Area
Average Home Value in this Area
Purchase History
| Date | Buyer | Sale Price | Title Company |
|---|---|---|---|
| Easton Dillan J | $97,000 | None Available |
Source: Public Records
Mortgage History
| Date | Status | Borrower | Loan Amount |
|---|---|---|---|
| Open | Easton Dillan J | $94,090 |
Source: Public Records
Tax History Compared to Growth
Tax History
| Year | Tax Paid | Tax Assessment Tax Assessment Total Assessment is a certain percentage of the fair market value that is determined by local assessors to be the total taxable value of land and additions on the property. | Land | Improvement |
|---|---|---|---|---|
| 2025 | $3,202 | $183,100 | $34,800 | $148,300 |
| 2024 | $3,202 | $162,800 | $30,500 | $132,300 |
| 2023 | $3,068 | $162,800 | $30,500 | $132,300 |
| 2022 | $3,046 | $130,200 | $25,100 | $105,100 |
| 2021 | $2,862 | $130,200 | $25,100 | $105,100 |
| 2020 | $2,974 | $114,700 | $22,000 | $92,700 |
| 2019 | $2,654 | $114,700 | $22,000 | $92,700 |
| 2018 | $2,622 | $107,300 | $19,400 | $87,900 |
| 2017 | $2,442 | $107,300 | $19,400 | $87,900 |
| 2016 | $2,374 | $98,800 | $17,600 | $81,200 |
| 2015 | $2,374 | $98,800 | $17,600 | $81,200 |
| 2014 | $2,306 | $99,000 | $17,300 | $81,700 |
Source: Public Records
Map
Nearby Homes
- 6204 SW 5th St
- 5812 SW 5th St
- 5814 SW 3rd St
- 5936 SW 2nd St
- 303 Porter Ave
- 217 E Payton Ave
- 5501 S Union St
- 1010 Frederick Ave
- 5407 SW 9th St
- 5402 SW 8th St
- 313 E Payton Ave
- 1029 Bundy St
- 1210 Highview Dr
- 520 Hackley Ave
- 401 E Wall Ave
- 1161 Bundy St
- 299 Hackley Ave
- 5600 SE 4th St
- 1225 West St
- 433 E Payton Ave