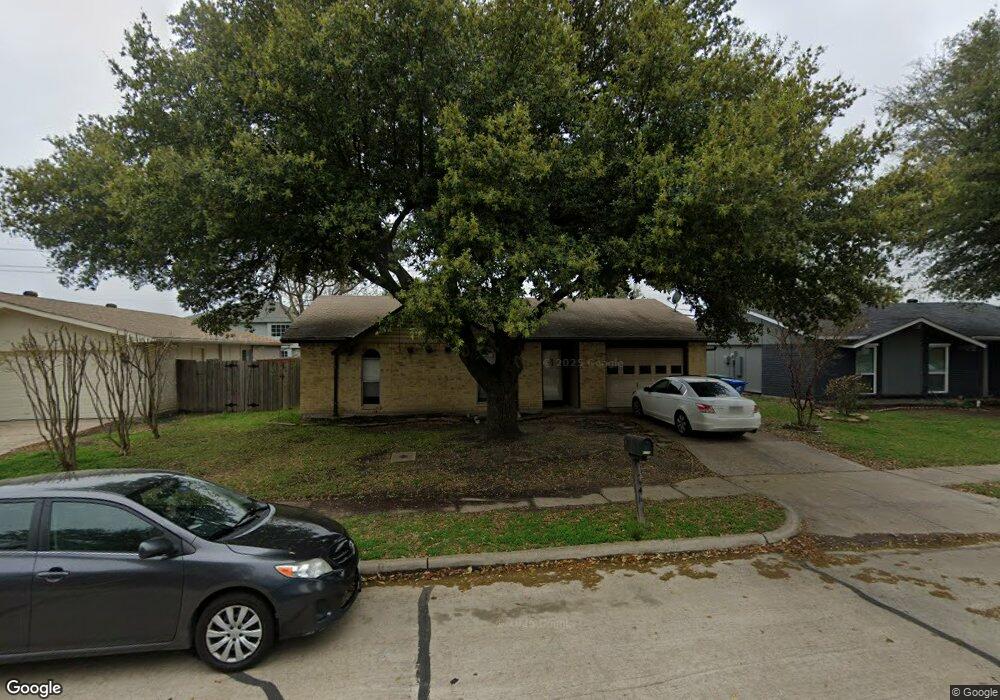
6016 Maple Ln Rowlett, TX 75089
Springfield NeighborhoodEstimated Value: $232,000 - $264,000
3
Beds
2
Baths
1,258
Sq Ft
$202/Sq Ft
Est. Value
About This Home
This home is located at 6016 Maple Ln, Rowlett, TX 75089 and is currently estimated at $253,707, approximately $201 per square foot. 6016 Maple Ln is a home located in Dallas County with nearby schools including Harmony Science Academy - Garland, Harmony School of Innovation - Garland, and Wesleyan Christian Academy.
Ownership History
Date
Name
Owned For
Owner Type
Purchase Details
Closed on
Nov 14, 2012
Sold by
Dallas Metro Holdings Llc
Bought by
Mccallister Gerri
Current Estimated Value
Home Financials for this Owner
Home Financials are based on the most recent Mortgage that was taken out on this home.
Original Mortgage
$57,400
Interest Rate
3.43%
Mortgage Type
Purchase Money Mortgage
Purchase Details
Closed on
Oct 26, 2012
Sold by
Burch Sheryl
Bought by
The Real Advantage Inc
Home Financials for this Owner
Home Financials are based on the most recent Mortgage that was taken out on this home.
Original Mortgage
$57,400
Interest Rate
3.43%
Mortgage Type
Purchase Money Mortgage
Purchase Details
Closed on
May 6, 1994
Sold by
Pittman T David and Hostutler Asa
Bought by
Burch Sheryl
Home Financials for this Owner
Home Financials are based on the most recent Mortgage that was taken out on this home.
Original Mortgage
$49,949
Interest Rate
8.03%
Mortgage Type
FHA
Create a Home Valuation Report for This Property
The Home Valuation Report is an in-depth analysis detailing your home's value as well as a comparison with similar homes in the area
Home Values in the Area
Average Home Value in this Area
Purchase History
| Date | Buyer | Sale Price | Title Company |
|---|---|---|---|
| Mccallister Gerri | -- | None Available | |
| Dallas Metro Holdings Llc | -- | None Available | |
| The Real Advantage Inc | -- | Adobe Title | |
| Burch Sheryl | -- | -- |
Source: Public Records
Mortgage History
| Date | Status | Borrower | Loan Amount |
|---|---|---|---|
| Closed | Mccallister Gerri | $57,400 | |
| Closed | The Real Advantage Inc | $40,000 | |
| Previous Owner | Burch Sheryl | $49,949 |
Source: Public Records
Tax History
| Year | Tax Paid | Tax Assessment Tax Assessment Total Assessment is a certain percentage of the fair market value that is determined by local assessors to be the total taxable value of land and additions on the property. | Land | Improvement |
|---|---|---|---|---|
| 2025 | $5,897 | $250,540 | $65,000 | $185,540 |
| 2024 | $5,897 | $250,540 | $65,000 | $185,540 |
| 2023 | $5,897 | $250,540 | $65,000 | $185,540 |
| 2022 | $5,544 | $228,800 | $50,000 | $178,800 |
| 2021 | $4,537 | $173,310 | $38,000 | $135,310 |
| 2020 | $4,577 | $173,310 | $38,000 | $135,310 |
| 2019 | $4,737 | $164,850 | $38,000 | $126,850 |
| 2018 | $4,364 | $150,790 | $33,000 | $117,790 |
| 2017 | $3,651 | $125,830 | $25,000 | $100,830 |
| 2016 | $3,651 | $125,830 | $25,000 | $100,830 |
| 2015 | $2,165 | $93,060 | $15,000 | $78,060 |
| 2014 | $2,165 | $80,050 | $15,000 | $65,050 |
Source: Public Records
Map
Nearby Homes
- 6004 Mimosa Ln
- 6017 Mimosa Ln
- 6317 Locust St
- 6105 Teresa Ln
- 3214 Cedar Ln
- 5905 Cedar Ln
- 5516 Maple Ln
- 5610 Magnolia Ln
- 6306 Debbie Cir
- 3422 Jonquil Ln
- 1513 Columbus Dr
- 5806 Beacon Dr
- 2601 Daisy Ln
- 7005 Buckhorn Dr
- 6518 Day Farm Ct
- 3405 Tulip Ln
- 5810 Kittyhawk Dr
- 3506 Lily Ln
- 3416 Aster Ln
- 2600 Primrose Ln
Your Personal Tour Guide
Ask me questions while you tour the home.