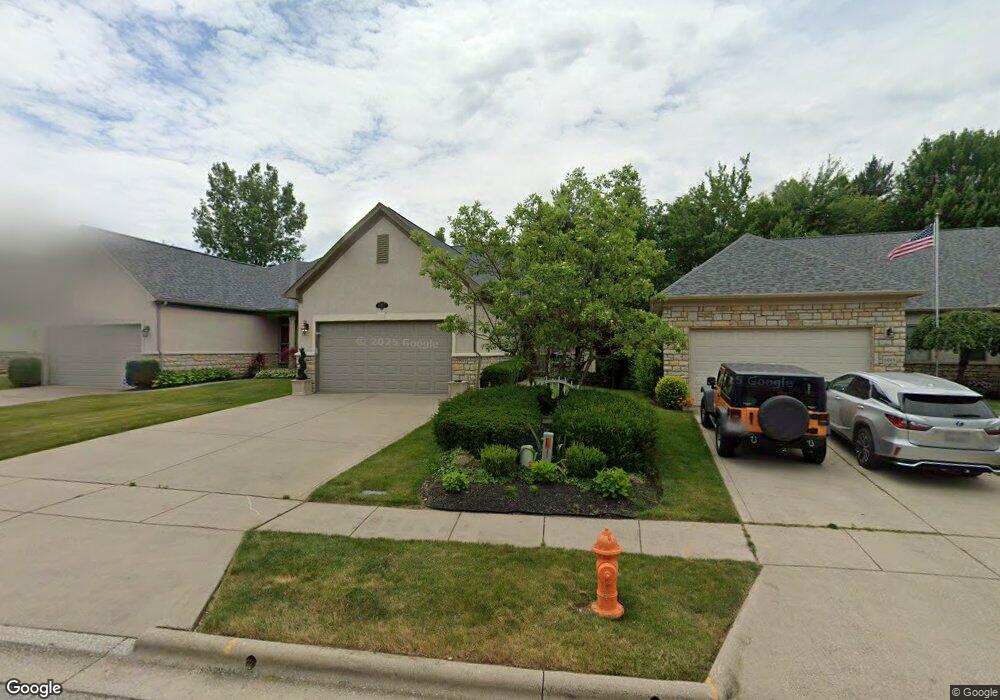
6017 McNaughten Grove Ln Columbus, OH 43213
Olde Orchard NeighborhoodEstimated Value: $341,723 - $455,000
3
Beds
3
Baths
1,571
Sq Ft
$253/Sq Ft
Est. Value
About This Home
This home is located at 6017 McNaughten Grove Ln, Columbus, OH 43213 and is currently estimated at $397,181, approximately $252 per square foot. 6017 McNaughten Grove Ln is a home located in Franklin County with nearby schools including Olde Orchard Elementary School, Sherwood Middle School, and Walnut Ridge High School.
Ownership History
Date
Name
Owned For
Owner Type
Purchase Details
Closed on
Jul 10, 2024
Sold by
Carole Lynn Rubin Revocable Trust and Fitzpatrick Eric C
Bought by
Fitzpatrick Eric C
Current Estimated Value
Purchase Details
Closed on
Nov 13, 2018
Sold by
Cox Evelyn L and Cox James W
Bought by
Rubin Carole Lynn and Carole Lynn Rubin Revocable Trust
Purchase Details
Closed on
Sep 30, 2011
Sold by
Cox Evelyn L
Bought by
Cox Evelyn L and Budinsky Penny L
Purchase Details
Closed on
Mar 22, 2002
Sold by
Morrone Okeefe Mcnaughten Road Developme
Bought by
Cox James W and Cox Evelyn L
Home Financials for this Owner
Home Financials are based on the most recent Mortgage that was taken out on this home.
Original Mortgage
$90,000
Interest Rate
6.93%
Create a Home Valuation Report for This Property
The Home Valuation Report is an in-depth analysis detailing your home's value as well as a comparison with similar homes in the area
Home Values in the Area
Average Home Value in this Area
Purchase History
| Date | Buyer | Sale Price | Title Company |
|---|---|---|---|
| Fitzpatrick Eric C | -- | None Listed On Document | |
| Rubin Carole Lynn | $183,400 | Title Co Ltd Box | |
| Rubin Carole Lynn | $91,700 | Title Co Ltd Box | |
| Cox Evelyn L | -- | Title Co Lt | |
| Cox James W | $225,900 | Midland Celtic Title |
Source: Public Records
Mortgage History
| Date | Status | Borrower | Loan Amount |
|---|---|---|---|
| Previous Owner | Cox James W | $90,000 |
Source: Public Records
Tax History Compared to Growth
Tax History
| Year | Tax Paid | Tax Assessment Tax Assessment Total Assessment is a certain percentage of the fair market value that is determined by local assessors to be the total taxable value of land and additions on the property. | Land | Improvement |
|---|---|---|---|---|
| 2024 | $4,922 | $107,390 | $24,120 | $83,270 |
| 2023 | $4,352 | $107,380 | $24,115 | $83,265 |
| 2022 | $5,813 | $83,410 | $21,180 | $62,230 |
| 2021 | $3,879 | $83,410 | $21,180 | $62,230 |
| 2020 | $3,884 | $83,410 | $21,180 | $62,230 |
| 2019 | $3,686 | $69,510 | $17,640 | $51,870 |
| 2018 | $3,772 | $69,510 | $17,640 | $51,870 |
| 2017 | $3,972 | $69,510 | $17,640 | $51,870 |
| 2016 | $4,259 | $73,050 | $10,610 | $62,440 |
| 2015 | $3,867 | $73,050 | $10,610 | $62,440 |
| 2014 | $3,876 | $73,050 | $10,610 | $62,440 |
| 2013 | $2,153 | $81,165 | $11,795 | $69,370 |
Source: Public Records
Map
Nearby Homes
- 6033 McNaughten Grove Ln
- Oxford Plan at Icon Villas at McNaughten
- Ashton Plan at Icon Villas at McNaughten
- 6040 Naughten Pond Dr
- 6052 Naughten Pond Dr
- 6056 Naughten Pond Dr
- 5882 Timber Dr
- 5850 Forestview Dr
- 5613 Chowning Way Unit 6B
- 557 Woodingham Place Unit 1A
- 541 Woodingham Place Unit 2-C
- 807 McNaughten Rd
- 187 McNaughten Rd
- 6279 Braiden Ct Unit 10B
- 856 Cummington Rd
- 5671 Bastille Place
- 6231 Peach Tree Rd
- 6258 Peach Tree Rd
- 6193 Stornoway Dr S Unit 6193
- 85 Stornoway Dr W Unit 85
- 6021 McNaughten Grove Ln
- 6013 McNaughten Grove Ln
- 6025 McNaughten Grove Ln
- 6009 McNaughten Grove Ln
- 6029 McNaughten Grove Ln
- 6005 McNaughten Grove Ln
- 5872 Hickory Brook Way Unit 5872
- 6001 McNaughten Grove Ln
- 5856 Hickory Brook Way Unit 5856
- 5876 Hickory Brook Way Unit 5876
- 6037 McNaughten Grove Ln
- 5880 Hickory Brook Way Unit 5880
- 6014 McNaughten Grove Ln
- 6018 McNaughten Grove Ln
- 5884 Hickory Brook Way Unit 5884
- 5852 Hickory Brook Way Unit 5852
- 6010 McNaughten Grove Ln
- 6022 McNaughten Grove Ln
- 5990 McNaughten Grove Ln
- 5997 McNaughten Grove Ln