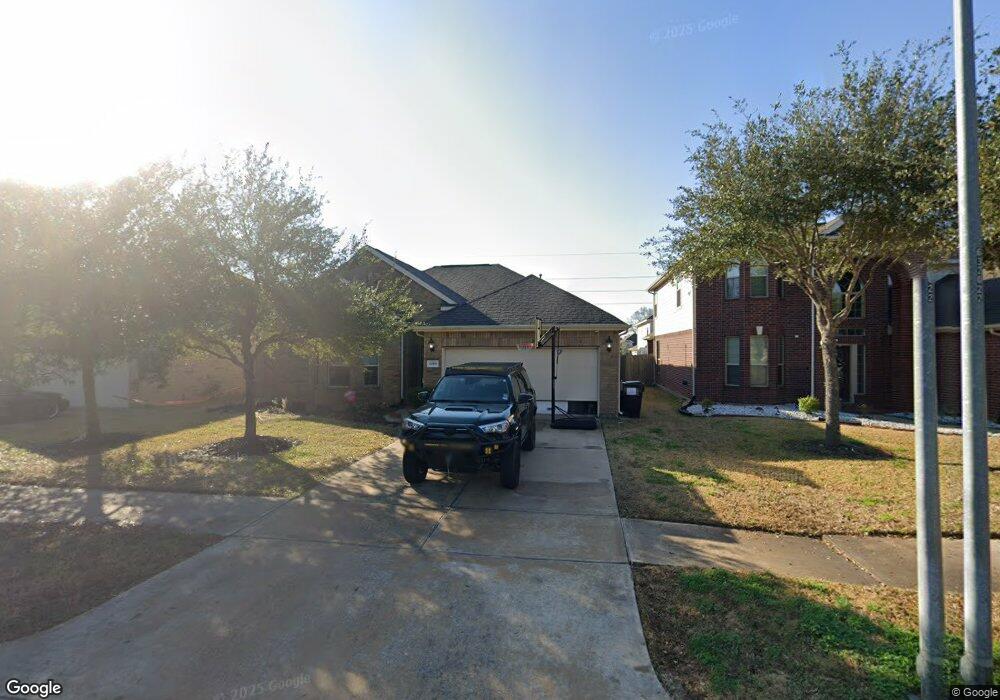
6019 Carnaby Ln Rosenberg, TX 77471
Estimated Value: $297,643 - $316,000
3
Beds
2
Baths
2,102
Sq Ft
$147/Sq Ft
Est. Value
About This Home
This home is located at 6019 Carnaby Ln, Rosenberg, TX 77471 and is currently estimated at $308,161, approximately $146 per square foot. 6019 Carnaby Ln is a home located in Fort Bend County with nearby schools including Jackson Elementary School, Henry Wertheimer Middle School, and Briscoe Junior High School.
Ownership History
Date
Name
Owned For
Owner Type
Purchase Details
Closed on
Feb 16, 2016
Sold by
Gonzalez Carlos and Gonzalez Maria
Bought by
Parham Gordon Cooper
Current Estimated Value
Home Financials for this Owner
Home Financials are based on the most recent Mortgage that was taken out on this home.
Original Mortgage
$190,000
Outstanding Balance
$151,563
Interest Rate
3.97%
Mortgage Type
New Conventional
Estimated Equity
$156,598
Purchase Details
Closed on
Jan 21, 2011
Sold by
Lennar Homes Of Texas Sales & Marketing
Bought by
Gonzalez Carlos
Home Financials for this Owner
Home Financials are based on the most recent Mortgage that was taken out on this home.
Original Mortgage
$106,950
Interest Rate
4.56%
Mortgage Type
New Conventional
Create a Home Valuation Report for This Property
The Home Valuation Report is an in-depth analysis detailing your home's value as well as a comparison with similar homes in the area
Home Values in the Area
Average Home Value in this Area
Purchase History
| Date | Buyer | Sale Price | Title Company |
|---|---|---|---|
| Parham Gordon Cooper | $190,000 | None Available | |
| Gonzalez Carlos | -- | North American Title Company | |
| Lennar Homes Of Texas Sales & Marketing | -- | North American Title Company | |
| Parham Gordon Cooper | -- | -- |
Source: Public Records
Mortgage History
| Date | Status | Borrower | Loan Amount |
|---|---|---|---|
| Open | Parham Gordon Cooper | $190,000 | |
| Previous Owner | Gonzalez Carlos | $106,950 |
Source: Public Records
Tax History Compared to Growth
Tax History
| Year | Tax Paid | Tax Assessment Tax Assessment Total Assessment is a certain percentage of the fair market value that is determined by local assessors to be the total taxable value of land and additions on the property. | Land | Improvement |
|---|---|---|---|---|
| 2025 | $7,944 | $297,320 | $46,683 | $250,637 |
| 2024 | $7,944 | $304,513 | $46,683 | $257,830 |
| 2023 | $8,032 | $303,879 | $35,910 | $267,969 |
| 2022 | $7,535 | $269,770 | $35,910 | $233,860 |
| 2021 | $5,700 | $203,940 | $35,910 | $168,030 |
| 2020 | $5,640 | $199,850 | $35,910 | $163,940 |
| 2019 | $5,801 | $196,390 | $35,910 | $160,480 |
| 2018 | $5,818 | $196,600 | $34,200 | $162,400 |
| 2017 | $5,766 | $194,540 | $34,200 | $160,340 |
| 2016 | $5,713 | $192,730 | $34,200 | $158,530 |
| 2015 | $3,360 | $179,080 | $34,200 | $144,880 |
| 2014 | $2,947 | $156,360 | $34,200 | $122,160 |
Source: Public Records
Map
Nearby Homes
- 5914 Prince Place Dr
- 2019 Preston Park
- 6135 Carnaby Ln
- 5815 Watford Bend
- 2202 Winchester Lake
- 6015 Biltmore
- 2227 Leonetti Ln
- 6018 Wickshire Dr
- 6111 Wickshire Dr
- Tuscaloosa Plan at Kingdom Heights
- Tacoma Plan at Kingdom Heights
- 5539 Bowquiver Ln
- Davenport Plan at Kingdom Heights
- 5515 Handlewood Ln
- Pasadena ESP Plan at Kingdom Heights
- El Paso Plan at Kingdom Heights
- 2618 Clapbread Ln
- Boise Plan at Kingdom Heights
- The Oleander (L401) Plan at Kingdom Heights
- The Royal (L481) Plan at Kingdom Heights
- 6023 Carnaby Ln
- 6027 Carnaby Ln
- 6027 Carnaby Ln
- 6011 Carnaby Ln
- 6022 Prince Place Dr
- 6018 Prince Place Dr
- 6026 Prince Place Dr
- 6014 Prince Place Dr
- 6030 Prince Place Dr
- 6031 Carnaby Ln
- 6018 Carnaby Ln
- 6014 Carnaby Ln
- 6022 Carnaby Ln
- 6010 Prince Place Dr
- 6034 Prince Place Dr
- 6010 Carnaby Ln
- 6026 Carnaby Ln
- 6006 Prince Place Dr
- 6102 Prince Place Dr
- 6003 Carnaby Ln