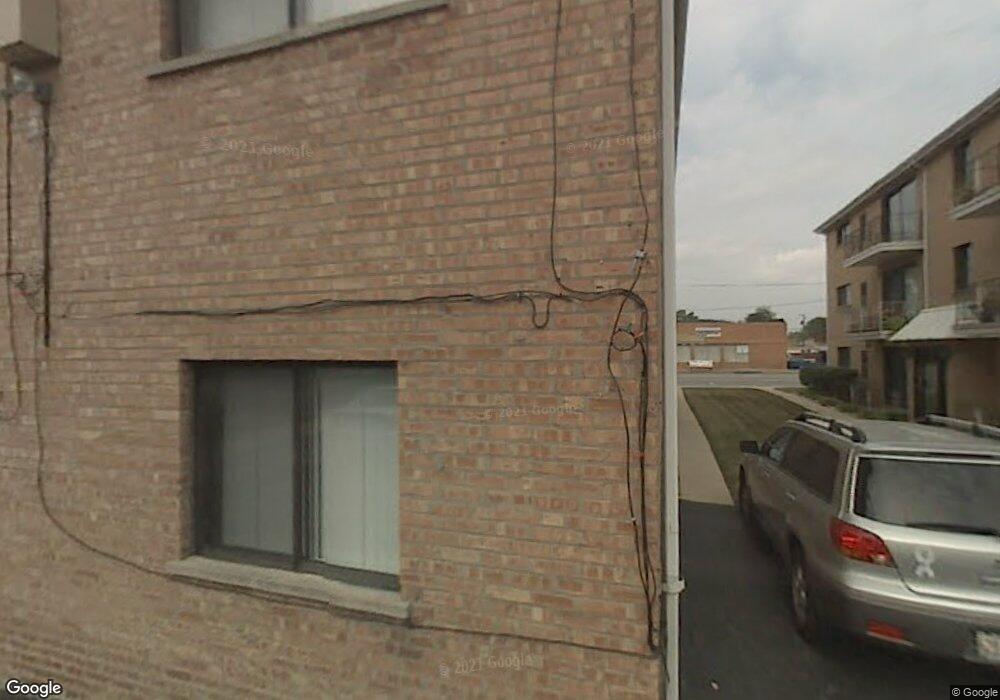
6019 S Archer Ave Unit 1S Chicago, IL 60638
Garfield Ridge NeighborhoodEstimated Value: $154,000 - $164,896
2
Beds
1
Bath
810
Sq Ft
$195/Sq Ft
Est. Value
About This Home
This home is located at 6019 S Archer Ave Unit 1S, Chicago, IL 60638 and is currently estimated at $158,224, approximately $195 per square foot. 6019 S Archer Ave Unit 1S is a home located in Cook County with nearby schools including Twain Elementary School, Kennedy High School, and Gloria Dei Lutheran School.
Ownership History
Date
Name
Owned For
Owner Type
Purchase Details
Closed on
Dec 19, 2019
Sold by
Gutowski Eva
Bought by
Solis Rosa G
Current Estimated Value
Home Financials for this Owner
Home Financials are based on the most recent Mortgage that was taken out on this home.
Original Mortgage
$112,100
Outstanding Balance
$99,121
Interest Rate
3.75%
Mortgage Type
New Conventional
Estimated Equity
$59,103
Purchase Details
Closed on
Jul 20, 2005
Sold by
Krzywinski Andrzej
Bought by
Gutowski Eva
Purchase Details
Closed on
Nov 26, 2001
Sold by
Capital Acquisitions & Development Inc
Bought by
Villalabos David A and Marquardt Gregory P
Home Financials for this Owner
Home Financials are based on the most recent Mortgage that was taken out on this home.
Original Mortgage
$68,000
Interest Rate
6.6%
Create a Home Valuation Report for This Property
The Home Valuation Report is an in-depth analysis detailing your home's value as well as a comparison with similar homes in the area
Home Values in the Area
Average Home Value in this Area
Purchase History
| Date | Buyer | Sale Price | Title Company |
|---|---|---|---|
| Solis Rosa G | $118,000 | Fidelity National Title | |
| Gutowski Eva | -- | -- | |
| Villalabos David A | $85,000 | -- |
Source: Public Records
Mortgage History
| Date | Status | Borrower | Loan Amount |
|---|---|---|---|
| Open | Solis Rosa G | $112,100 | |
| Previous Owner | Villalabos David A | $68,000 |
Source: Public Records
Tax History Compared to Growth
Tax History
| Year | Tax Paid | Tax Assessment Tax Assessment Total Assessment is a certain percentage of the fair market value that is determined by local assessors to be the total taxable value of land and additions on the property. | Land | Improvement |
|---|---|---|---|---|
| 2024 | $1,842 | $14,766 | $1,417 | $13,349 |
| 2023 | $1,774 | $12,000 | $1,265 | $10,735 |
| 2022 | $1,774 | $12,000 | $1,265 | $10,735 |
| 2021 | $1,743 | $11,999 | $1,265 | $10,734 |
| 2020 | $1,256 | $8,706 | $1,012 | $7,694 |
| 2019 | $1,265 | $9,688 | $1,012 | $8,676 |
| 2018 | $1,243 | $9,688 | $1,012 | $8,676 |
| 2017 | $1,761 | $11,504 | $910 | $10,594 |
| 2016 | $1,816 | $11,504 | $910 | $10,594 |
| 2015 | $1,639 | $11,504 | $910 | $10,594 |
| 2014 | $1,428 | $10,207 | $860 | $9,347 |
| 2013 | $1,389 | $10,207 | $860 | $9,347 |
Source: Public Records
Map
Nearby Homes
- 5850 W 55th St Unit 3D
- 5245 S Mayfield Ave
- 5533 S Menard Ave
- 5712 W 56th St
- 5108 S Massasoit Ave
- 5127 S Parkside Ave
- 5121 S Central Ave
- 5700 S Monitor Ave
- 5107 S Luna Ave
- 5417 S Melvina Ave Unit 102
- 5128 S Meade Ave
- 5237 S Long Ave
- 5621 S Moody Ave
- 5254 S Melvina Ave
- 5814 S Massasoit Ave
- 5727 S Meade Ave
- 5810 S Austin Ave
- 5118 S Melvina Ave
- 5141 S Merrimac Ave
- 6340 S Archer Ave
- 6019 S Archer Ave
- 6019 S Archer Ave Unit 1S
- 6019 S Archer Ave Unit 60192N
- 6019 S Archer Ave Unit 60193S
- 6019 S Archer Ave Unit 60193N
- 6019 S Archer Ave Unit 60192S
- 6019 S Archer Ave Unit 60191N
- 6019 S Archer Ave Unit 60191S
- 6019 S Archer Ave Unit 3N
- 6015 S Archer Ave Unit 60151S
- 6015 S Archer Ave Unit 60153N
- 6015 S Archer Ave Unit 60152N
- 6015 S Archer Ave Unit 60153S
- 6015 S Archer Ave Unit 60151N
- 6015 S Archer Ave Unit 60152S
- 6015 S Archer Ave Unit 1S
- 6015 S Archer Ave Unit 3S
- 5415 S Menard Ave Unit 2
- 6003 S Archer Ave
- 5417 S Menard Ave