602 11th St Midfield, AL 35228
Estimated Value: $77,115 - $85,000
2
Beds
1
Bath
988
Sq Ft
$84/Sq Ft
Est. Value
About This Home
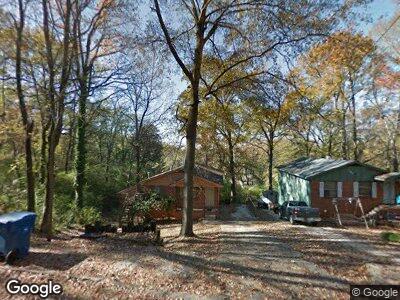
This home is located at 602 11th St, Midfield, AL 35228 and is currently estimated at $82,529, approximately $83 per square foot. 602 11th St is a home located in Jefferson County with nearby schools including Midfield Elementary School, Rutledge Middle School, and Midfield High School.
Ownership History
Date
Name
Owned For
Owner Type
Purchase Details
Closed on
Jul 22, 2010
Sold by
Inman T L and Inman Elizabeth
Bought by
Bolling Christalyn D
Current Estimated Value
Home Financials for this Owner
Home Financials are based on the most recent Mortgage that was taken out on this home.
Original Mortgage
$52,295
Outstanding Balance
$36,227
Interest Rate
5.12%
Mortgage Type
FHA
Estimated Equity
$49,606
Purchase Details
Closed on
Dec 21, 2000
Sold by
Hill Willie Clyde
Bought by
Star Bank Na
Purchase Details
Closed on
Dec 22, 1997
Sold by
Hill Lisa A
Bought by
Hill Willie Clyde
Create a Home Valuation Report for This Property
The Home Valuation Report is an in-depth analysis detailing your home's value as well as a comparison with similar homes in the area
Home Values in the Area
Average Home Value in this Area
Purchase History
| Date | Buyer | Sale Price | Title Company |
|---|---|---|---|
| Bolling Christalyn D | $53,000 | None Available | |
| Star Bank Na | $60,810 | -- | |
| Hill Willie Clyde | -- | -- |
Source: Public Records
Mortgage History
| Date | Status | Borrower | Loan Amount |
|---|---|---|---|
| Open | Bolling Christalyn D | $52,295 | |
| Previous Owner | Hill Willie Clyde | $3,791 | |
| Previous Owner | Hill Willie Clyde | $62,200 |
Source: Public Records
Tax History Compared to Growth
Tax History
| Year | Tax Paid | Tax Assessment Tax Assessment Total Assessment is a certain percentage of the fair market value that is determined by local assessors to be the total taxable value of land and additions on the property. | Land | Improvement |
|---|---|---|---|---|
| 2024 | $525 | $7,340 | -- | -- |
| 2022 | $482 | $6,480 | $1,530 | $4,950 |
| 2021 | $429 | $5,830 | $1,530 | $4,300 |
| 2020 | $434 | $5,830 | $1,530 | $4,300 |
| 2019 | $429 | $5,840 | $0 | $0 |
| 2018 | $364 | $5,060 | $0 | $0 |
| 2017 | $364 | $5,060 | $0 | $0 |
| 2016 | $364 | $5,060 | $0 | $0 |
| 2015 | $364 | $5,060 | $0 | $0 |
| 2014 | $341 | $4,980 | $0 | $0 |
| 2013 | $341 | $4,980 | $0 | $0 |
Source: Public Records
Map
Nearby Homes