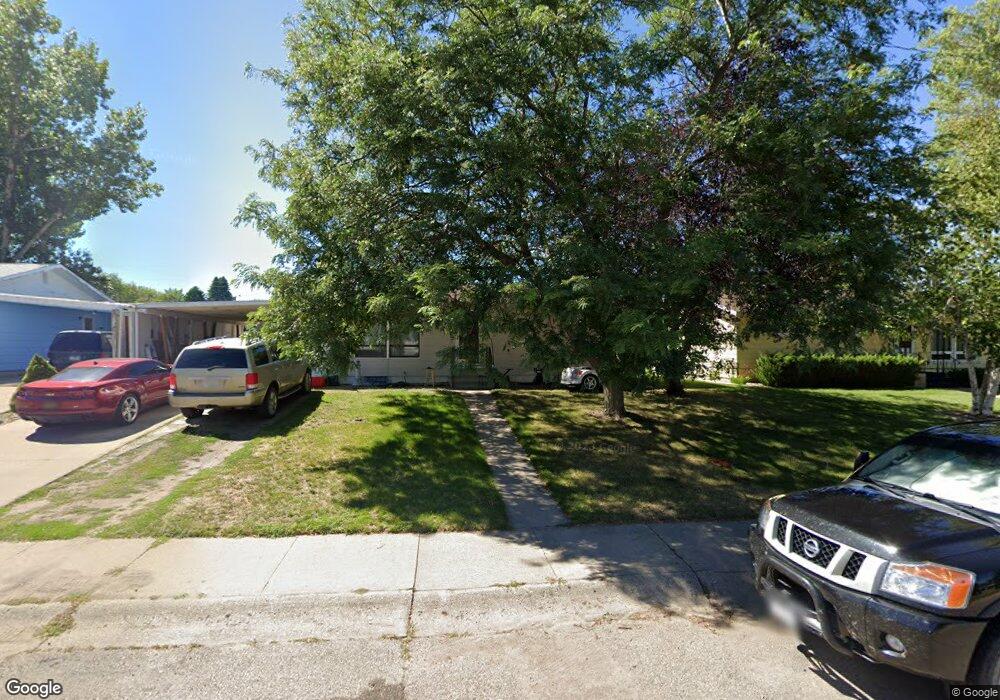
602 53rd St S Great Falls, MT 59405
Estimated Value: $288,000 - $401,000
4
Beds
3
Baths
2,752
Sq Ft
$128/Sq Ft
Est. Value
About This Home
This home is located at 602 53rd St S, Great Falls, MT 59405 and is currently estimated at $353,072, approximately $128 per square foot. 602 53rd St S is a home located in Cascade County with nearby schools including Chief Joseph School, East Middle School, and Great Falls High School.
Ownership History
Date
Name
Owned For
Owner Type
Purchase Details
Closed on
Nov 4, 2011
Sold by
Macy Mark A and Macy Karan A
Bought by
Watras Rosanna K and Anderson Melinda L
Current Estimated Value
Home Financials for this Owner
Home Financials are based on the most recent Mortgage that was taken out on this home.
Original Mortgage
$152,196
Outstanding Balance
$103,783
Interest Rate
4.02%
Mortgage Type
New Conventional
Estimated Equity
$249,289
Purchase Details
Closed on
Jul 26, 2007
Sold by
Chiavaras Ross A and Chiavaras Colleen D
Bought by
Macy Mark A and Macy Karan A
Home Financials for this Owner
Home Financials are based on the most recent Mortgage that was taken out on this home.
Original Mortgage
$127,200
Interest Rate
6.73%
Mortgage Type
New Conventional
Purchase Details
Closed on
Mar 30, 2005
Sold by
Chiavaris Colleen D and Chiavaras Colleen D
Bought by
Chiavaras Colleen D
Create a Home Valuation Report for This Property
The Home Valuation Report is an in-depth analysis detailing your home's value as well as a comparison with similar homes in the area
Home Values in the Area
Average Home Value in this Area
Purchase History
| Date | Buyer | Sale Price | Title Company |
|---|---|---|---|
| Watras Rosanna K | -- | Stewart Title | |
| Macy Mark A | -- | Chicago Title Insurance Comp | |
| Chiavaras Colleen D | -- | None Available |
Source: Public Records
Mortgage History
| Date | Status | Borrower | Loan Amount |
|---|---|---|---|
| Open | Watras Rosanna K | $152,196 | |
| Previous Owner | Macy Mark A | $127,200 | |
| Previous Owner | Macy Mark A | $23,850 |
Source: Public Records
Tax History Compared to Growth
Tax History
| Year | Tax Paid | Tax Assessment Tax Assessment Total Assessment is a certain percentage of the fair market value that is determined by local assessors to be the total taxable value of land and additions on the property. | Land | Improvement |
|---|---|---|---|---|
| 2025 | $1,770 | $335,200 | $0 | $0 |
| 2024 | $2,921 | $284,100 | $0 | $0 |
| 2023 | $2,868 | $284,100 | $0 | $0 |
| 2022 | $2,415 | $213,500 | $0 | $0 |
| 2021 | $2,258 | $213,500 | $0 | $0 |
| 2020 | $2,301 | $197,000 | $0 | $0 |
| 2019 | $2,192 | $197,000 | $0 | $0 |
| 2018 | $2,048 | $180,500 | $0 | $0 |
| 2017 | $1,935 | $180,500 | $0 | $0 |
| 2016 | $1,734 | $170,900 | $0 | $0 |
| 2015 | $1,643 | $170,900 | $0 | $0 |
| 2014 | $1,860 | $95,824 | $0 | $0 |
Source: Public Records
Map
Nearby Homes