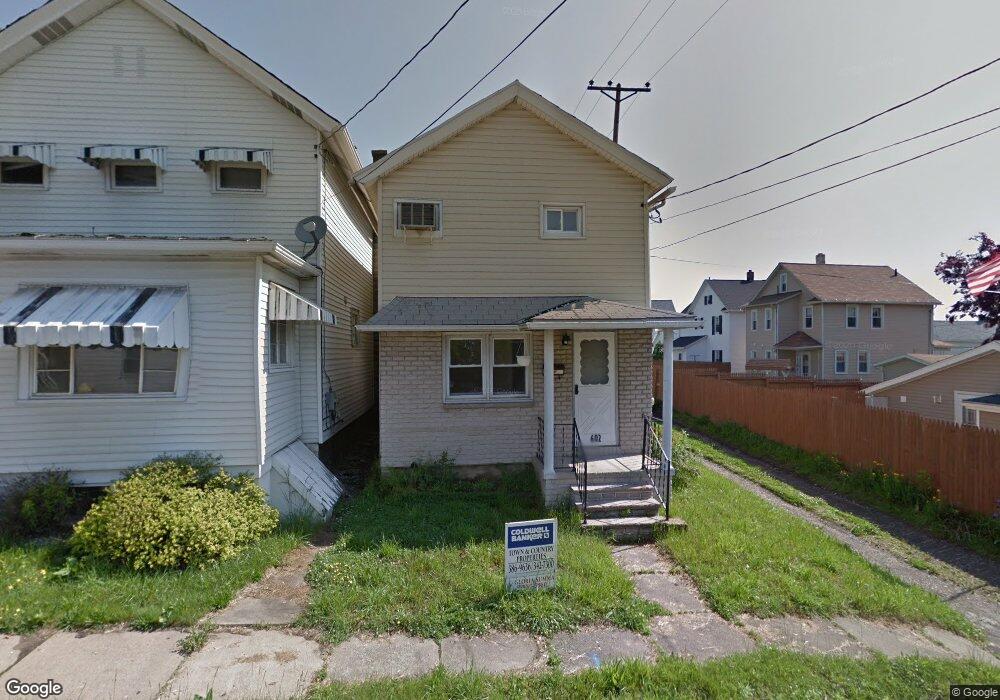
602 Archbald St Unit L83 Scranton, PA 18504
Hyde Park NeighborhoodEstimated Value: $68,000 - $130,000
3
Beds
1
Bath
1,305
Sq Ft
$85/Sq Ft
Est. Value
About This Home
This home is located at 602 Archbald St Unit L83, Scranton, PA 18504 and is currently estimated at $111,026, approximately $85 per square foot. 602 Archbald St Unit L83 is a home located in Lackawanna County with nearby schools including Longan Elementary School, Adams Elementary School, and Frances Willard School.
Ownership History
Date
Name
Owned For
Owner Type
Purchase Details
Closed on
Jan 15, 2021
Sold by
Santaniello Anthony and Santaniello Trudy
Bought by
Hebron Housing Development Llc
Current Estimated Value
Purchase Details
Closed on
Jul 1, 2010
Sold by
Stonecrest Income & Opportunity Fund I L
Bought by
Phoenix Capital Xxx Llc
Purchase Details
Closed on
Apr 19, 2010
Sold by
American General Consumer Discount Compa
Bought by
Stonecrest Income & Opportunity Fund I L
Purchase Details
Closed on
Nov 17, 2009
Sold by
Brodt Carmen and Brodt Sharon
Bought by
American General Consumer Discount Co
Create a Home Valuation Report for This Property
The Home Valuation Report is an in-depth analysis detailing your home's value as well as a comparison with similar homes in the area
Home Values in the Area
Average Home Value in this Area
Purchase History
| Date | Buyer | Sale Price | Title Company |
|---|---|---|---|
| Hebron Housing Development Llc | $41,000 | Blueprint Title Tn | |
| Phoenix Capital Xxx Llc | $13,000 | Brb Trust Title Agency | |
| Stonecrest Income & Opportunity Fund I L | $10,000 | None Available | |
| American General Consumer Discount Co | -- | None Available |
Source: Public Records
Tax History Compared to Growth
Tax History
| Year | Tax Paid | Tax Assessment Tax Assessment Total Assessment is a certain percentage of the fair market value that is determined by local assessors to be the total taxable value of land and additions on the property. | Land | Improvement |
|---|---|---|---|---|
| 2025 | $2,170 | $7,200 | $400 | $6,800 |
| 2024 | $1,973 | $7,200 | $400 | $6,800 |
| 2023 | $1,973 | $7,200 | $400 | $6,800 |
| 2022 | $1,929 | $7,200 | $400 | $6,800 |
| 2021 | $1,929 | $7,200 | $400 | $6,800 |
| 2020 | $1,891 | $7,200 | $400 | $6,800 |
| 2019 | $1,775 | $7,200 | $400 | $6,800 |
| 2018 | $1,775 | $7,200 | $400 | $6,800 |
| 2017 | $1,741 | $7,200 | $400 | $6,800 |
| 2016 | $437 | $7,200 | $400 | $6,800 |
| 2015 | $1,280 | $7,200 | $400 | $6,800 |
| 2014 | -- | $7,200 | $400 | $6,800 |
Source: Public Records
Map
Nearby Homes
- 1009 1011 Acker Ave Unit L 109
- 610 Landis St
- 625 Landis St
- 1203 Acker Ave
- 730 W Locust St
- 1250 S 1252 6th
- 924 S Main Ave
- 705 Hampton St
- 607 3rd Ave
- 901 Eynon St
- 727 Fellows St
- 1115 Watson St
- 1021 Fellows St
- 340 342 Railroad Ave
- 1234 Bryn Mawr St Unit 11
- 819 Luzerne St
- 1143 Reynolds Ave
- 407-409 10th Ave
- 414 S 416 S Edwards Ct
- 816 12th Ave
- 602 Archbald L83 St
- 604 Archbald St
- 606 Archbald St
- 931 Roland Ave
- 932 S 6th Ave
- 570 Archbald St
- 930 S 6th Ave
- 1002 S 6th Ave
- 1004 S 6th Ave
- 925 Roland Ave
- 565 Archbald St
- 924 S 6th Ave
- 1006 S 6th Ave
- 562 Archbald St
- 1043 S 6th Ave
- 921 Roland Ave
- 935 S 6th Ave
- 933 S 6th Ave
- 561 Archbald St
- 1014 S 6th Ave