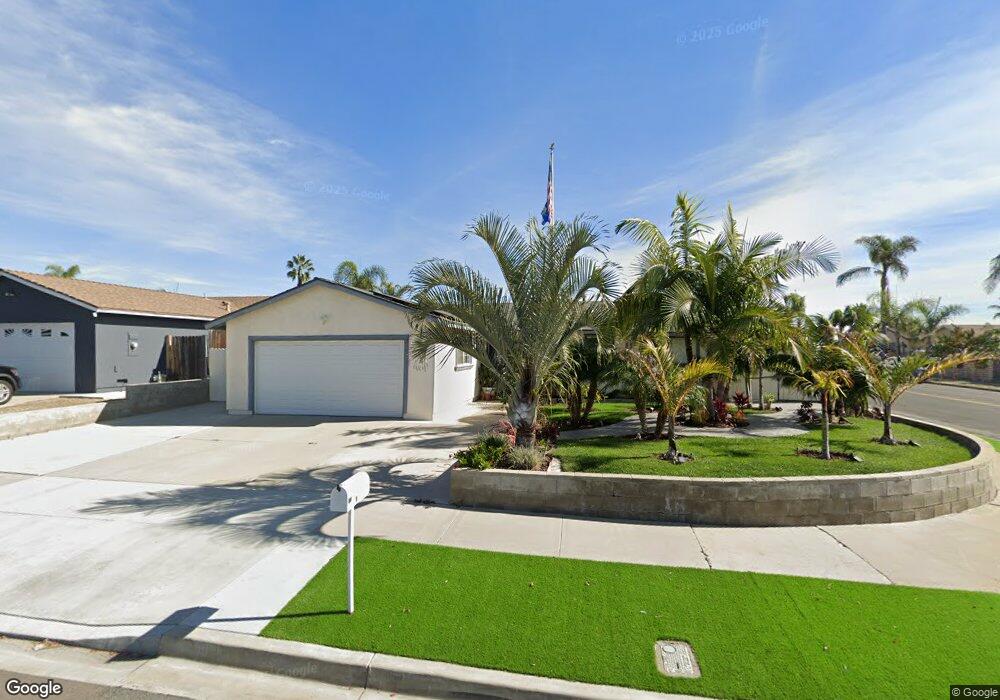
602 Charles Dr Oceanside, CA 92057
North Valley NeighborhoodEstimated Value: $702,000 - $788,000
3
Beds
2
Baths
1,348
Sq Ft
$560/Sq Ft
Est. Value
About This Home
This home is located at 602 Charles Dr, Oceanside, CA 92057 and is currently estimated at $755,250, approximately $560 per square foot. 602 Charles Dr is a home located in San Diego County with nearby schools including Del Rio Elementary School, Cesar Chavez Middle School, and El Camino High School.
Ownership History
Date
Name
Owned For
Owner Type
Purchase Details
Closed on
Dec 19, 2016
Sold by
Roillins Joseph P and Rollins Regina L
Bought by
Mccomas Anthony W and Bowe Amber R
Current Estimated Value
Home Financials for this Owner
Home Financials are based on the most recent Mortgage that was taken out on this home.
Original Mortgage
$398,646
Outstanding Balance
$325,329
Interest Rate
3.87%
Mortgage Type
FHA
Estimated Equity
$429,921
Purchase Details
Closed on
Oct 14, 1996
Sold by
Noa Fagu and Noa Faanenefu T
Bought by
Rollins Joseph P and Rollins Regina L
Home Financials for this Owner
Home Financials are based on the most recent Mortgage that was taken out on this home.
Original Mortgage
$86,700
Interest Rate
8.3%
Mortgage Type
VA
Purchase Details
Closed on
Sep 13, 1994
Sold by
Bartusevics John and Bartusevics Yasuko
Bought by
Noa Fagu and Noa Faanenefu T
Home Financials for this Owner
Home Financials are based on the most recent Mortgage that was taken out on this home.
Original Mortgage
$112,200
Interest Rate
8.86%
Mortgage Type
VA
Create a Home Valuation Report for This Property
The Home Valuation Report is an in-depth analysis detailing your home's value as well as a comparison with similar homes in the area
Home Values in the Area
Average Home Value in this Area
Purchase History
| Date | Buyer | Sale Price | Title Company |
|---|---|---|---|
| Mccomas Anthony W | $420,000 | Lawyers Title | |
| Rollins Joseph P | $85,000 | Fidelity National Title | |
| Noa Fagu | $110,000 | First American Title Co |
Source: Public Records
Mortgage History
| Date | Status | Borrower | Loan Amount |
|---|---|---|---|
| Open | Mccomas Anthony W | $398,646 | |
| Previous Owner | Rollins Joseph P | $86,700 | |
| Previous Owner | Noa Fagu | $112,200 |
Source: Public Records
Tax History
| Year | Tax Paid | Tax Assessment Tax Assessment Total Assessment is a certain percentage of the fair market value that is determined by local assessors to be the total taxable value of land and additions on the property. | Land | Improvement |
|---|---|---|---|---|
| 2025 | $5,316 | $487,437 | $268,365 | $219,072 |
| 2024 | $5,316 | $477,880 | $263,103 | $214,777 |
| 2023 | $5,151 | $468,511 | $257,945 | $210,566 |
| 2022 | $5,072 | $459,326 | $252,888 | $206,438 |
| 2021 | $5,090 | $450,321 | $247,930 | $202,391 |
| 2020 | $4,932 | $445,704 | $245,388 | $200,316 |
| 2019 | $4,788 | $436,966 | $240,577 | $196,389 |
| 2018 | $4,736 | $428,399 | $235,860 | $192,539 |
| 2017 | $1,298 | $119,262 | $65,661 | $53,601 |
| 2016 | $1,254 | $116,924 | $64,374 | $52,550 |
| 2015 | $1,217 | $115,169 | $63,408 | $51,761 |
| 2014 | $1,171 | $112,914 | $62,166 | $50,748 |
Source: Public Records
Map
Nearby Homes
- 663 Charles Dr
- 5033 Los Morros Way Unit 55
- 5034 Los Morros Way Unit 62
- 569 Gold Dr
- 5015 Macario Dr
- 5065 Waterview Way Unit 101
- 5065 Waterview Way
- 5063 Waterview Way Unit 101
- 5063 Waterview Way
- 5063 Waterview Way Unit 102
- 656 Parker St
- 4950 Luna Dr
- 5108 Andrew Jackson St
- 868 Panella Ct
- 4795 Claire Dr
- 671 Parker St
- 5133 Greenbrook St
- 4924 Verde Dr
- 4918 Roja Dr
- 273 Stallion Dr
Your Personal Tour Guide
Ask me questions while you tour the home.