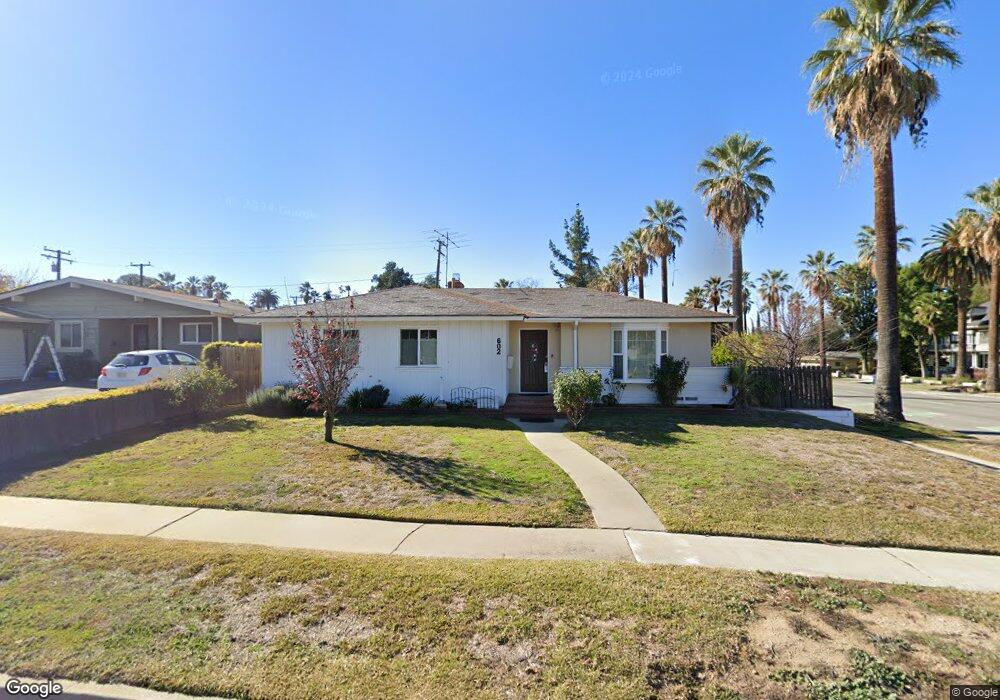
602 Esther Way Redlands, CA 92373
South Redlands NeighborhoodEstimated Value: $564,000 - $656,000
3
Beds
2
Baths
1,326
Sq Ft
$456/Sq Ft
Est. Value
About This Home
This home is located at 602 Esther Way, Redlands, CA 92373 and is currently estimated at $605,187, approximately $456 per square foot. 602 Esther Way is a home located in San Bernardino County with nearby schools including Kingsbury Elementary School, Cope Middle School, and Redlands Senior High School.
Ownership History
Date
Name
Owned For
Owner Type
Purchase Details
Closed on
Sep 20, 2017
Sold by
Quintero Deborah C and Murguia Olivia S
Bought by
Quintero Deborah C
Current Estimated Value
Home Financials for this Owner
Home Financials are based on the most recent Mortgage that was taken out on this home.
Original Mortgage
$285,000
Outstanding Balance
$237,931
Interest Rate
3.89%
Mortgage Type
New Conventional
Estimated Equity
$367,256
Purchase Details
Closed on
Aug 21, 2003
Sold by
Murguia Olivia S
Bought by
Murguia Olivia S and Murguia Deborah C
Purchase Details
Closed on
May 8, 2002
Sold by
Murguia Alejandro
Bought by
Murguia Olivia S
Purchase Details
Closed on
Dec 8, 1999
Sold by
Ruetmann Mihkel and Ruetmann Alide J
Bought by
Murguia Alejandro and Murguia Olivia S
Home Financials for this Owner
Home Financials are based on the most recent Mortgage that was taken out on this home.
Original Mortgage
$144,848
Interest Rate
7.84%
Mortgage Type
VA
Create a Home Valuation Report for This Property
The Home Valuation Report is an in-depth analysis detailing your home's value as well as a comparison with similar homes in the area
Home Values in the Area
Average Home Value in this Area
Purchase History
| Date | Buyer | Sale Price | Title Company |
|---|---|---|---|
| Quintero Deborah C | -- | Landsafe Services Inc | |
| Murguia Olivia S | -- | -- | |
| Murguia Olivia S | -- | -- | |
| Murguia Alejandro | $143,500 | Fidelity National Title |
Source: Public Records
Mortgage History
| Date | Status | Borrower | Loan Amount |
|---|---|---|---|
| Open | Quintero Deborah C | $285,000 | |
| Closed | Murguia Alejandro | $144,848 |
Source: Public Records
Tax History
| Year | Tax Paid | Tax Assessment Tax Assessment Total Assessment is a certain percentage of the fair market value that is determined by local assessors to be the total taxable value of land and additions on the property. | Land | Improvement |
|---|---|---|---|---|
| 2025 | $2,681 | $220,564 | $55,143 | $165,421 |
| 2024 | $2,504 | $216,239 | $54,062 | $162,177 |
| 2023 | $2,499 | $211,999 | $53,002 | $158,997 |
| 2022 | $2,462 | $207,842 | $51,963 | $155,879 |
| 2021 | $2,504 | $203,767 | $50,944 | $152,823 |
| 2020 | $2,467 | $201,678 | $50,422 | $151,256 |
| 2019 | $2,396 | $197,723 | $49,433 | $148,290 |
| 2018 | $2,336 | $193,846 | $48,464 | $145,382 |
| 2017 | $2,401 | $190,045 | $47,514 | $142,531 |
| 2016 | $2,374 | $186,318 | $46,582 | $139,736 |
| 2015 | $2,357 | $183,519 | $45,882 | $137,637 |
| 2014 | $2,315 | $179,924 | $44,983 | $134,941 |
Source: Public Records
Map
Nearby Homes
- 622 Esther Way
- 979 Kevin Ave
- 509 S 4th St
- 616 Monterey St
- 400 Walnut Ave
- 645 Cajon St
- 0 W Palm Ave Unit IV25244005
- 643 Cypress Cir
- 1029 W Palm Ave
- 525 La Verne St Unit 14
- 143 Walnut Ave
- 1033 W Palm Ave
- 316 S 4th St
- 421 La Verne St
- 434 Sonora Cir
- 423 Sonora Cir
- 331 Nordina St
- 302 Sonora St
- 108 S Buena Vista St
- 246 E Fern Ave Unit 109
- 606 Esther Way
- 631 W Cypress Ave
- 610 Esther Way
- 610 W Cypress Ave
- 645 W Cypress Ave
- 614 Esther Way
- 601 Esther Way
- 605 Esther Way
- 530 Esther Way
- 609 Esther Way
- 520 W Cypress Ave
- 618 Esther Way
- 640 W Cypress Ave
- 613 Esther Way
- 526 Esther Way
- 533 Esther Way
- 509 W Cypress Ave
- 646 W Cypress Ave
- 671 W Cypress Ave
- 617 Esther Way
Your Personal Tour Guide
Ask me questions while you tour the home.