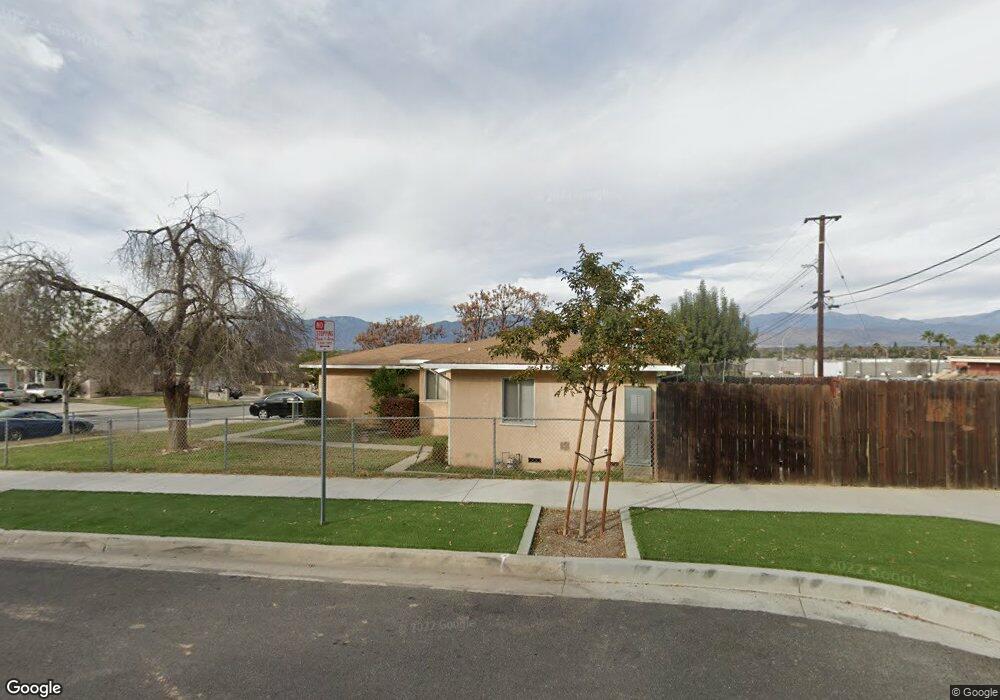
602 Greycliff Ave La Puente, CA 91744
Estimated Value: $666,868 - $769,000
3
Beds
1
Bath
1,006
Sq Ft
$724/Sq Ft
Est. Value
About This Home
This home is located at 602 Greycliff Ave, La Puente, CA 91744 and is currently estimated at $728,717, approximately $724 per square foot. 602 Greycliff Ave is a home located in Los Angeles County with nearby schools including Del Valle Elementary School, Sierra Vista Middle School, and William Workman High School.
Ownership History
Date
Name
Owned For
Owner Type
Purchase Details
Closed on
Jul 9, 2003
Sold by
Dolacki Robert and Dolacki Cheryl
Bought by
Bustamante Deane M
Current Estimated Value
Home Financials for this Owner
Home Financials are based on the most recent Mortgage that was taken out on this home.
Original Mortgage
$223,985
Outstanding Balance
$95,442
Interest Rate
5.29%
Mortgage Type
FHA
Estimated Equity
$633,275
Purchase Details
Closed on
Apr 3, 2001
Sold by
The Robert & Cheryl Dolacki Revocable Li
Bought by
Dolacki Robert and Dolacki Cheryl Darlene
Home Financials for this Owner
Home Financials are based on the most recent Mortgage that was taken out on this home.
Original Mortgage
$97,500
Interest Rate
8.62%
Purchase Details
Closed on
Dec 30, 2000
Sold by
Dolacki Marco G and Dolacki Family Trust
Bought by
The Robert & Cheryl Dolacki Revocable Li
Purchase Details
Closed on
Nov 14, 1998
Sold by
Dolacki George E and Dolacki Fairl J
Bought by
Dolacki George E and Dolacki Fairl J
Create a Home Valuation Report for This Property
The Home Valuation Report is an in-depth analysis detailing your home's value as well as a comparison with similar homes in the area
Home Values in the Area
Average Home Value in this Area
Purchase History
| Date | Buyer | Sale Price | Title Company |
|---|---|---|---|
| Bustamante Deane M | $227,500 | Ticor Title Company | |
| Dolacki Robert | -- | Chicago Title Co | |
| The Robert & Cheryl Dolacki Revocable Li | -- | -- | |
| Dolacki George E | -- | -- |
Source: Public Records
Mortgage History
| Date | Status | Borrower | Loan Amount |
|---|---|---|---|
| Open | Bustamante Deane M | $223,985 | |
| Previous Owner | Dolacki Robert | $97,500 |
Source: Public Records
Tax History Compared to Growth
Tax History
| Year | Tax Paid | Tax Assessment Tax Assessment Total Assessment is a certain percentage of the fair market value that is determined by local assessors to be the total taxable value of land and additions on the property. | Land | Improvement |
|---|---|---|---|---|
| 2025 | $4,236 | $323,439 | $226,342 | $97,097 |
| 2024 | $4,236 | $317,098 | $221,904 | $95,194 |
| 2023 | $4,131 | $310,881 | $217,553 | $93,328 |
| 2022 | $4,014 | $304,787 | $213,288 | $91,499 |
| 2021 | $3,944 | $298,811 | $209,106 | $89,705 |
| 2019 | $3,834 | $289,950 | $202,904 | $87,046 |
| 2018 | $3,697 | $284,266 | $198,926 | $85,340 |
| 2016 | $3,434 | $273,229 | $191,202 | $82,027 |
| 2015 | $3,372 | $269,125 | $188,330 | $80,795 |
| 2014 | $3,322 | $263,854 | $184,641 | $79,213 |
Source: Public Records
Map
Nearby Homes
- 665 Larimore Ave
- 11 Alley Way
- 826 Del Valle Ave
- 665 Lidford Ave
- 15879 Hill St
- 138 Banbridge Ave
- 545 N 5th St
- 15925 Amar Rd
- 15625 Loukelton St
- 15937 Amar Rd
- 15943 Amar Rd
- 15947 Amar Rd
- 15732 Victoria Ave
- 16138 Cadwell St
- 15900 Rowland St
- 16138 Blackwood St
- 15809 Fallen Leaf Rd
- 1084 Del Valle Ave
- 16841 Main St
- 428 Ferrero Ln
- 608 Greycliff Ave
- 614 Greycliff Ave
- 16157 Temple Ave
- 609 Greycliff Ave
- 620 Greycliff Ave
- 615 Greycliff Ave
- 621 Greycliff Ave
- 626 Greycliff Ave
- 602 Peggy Ave
- 610 Peggy Ave
- 616 Peggy Ave
- 627 Greycliff Ave
- 632 Greycliff Ave
- 622 Peggy Ave
- 633 Greycliff Ave
- 628 Peggy Ave
- 638 Greycliff Ave
- 639 Greycliff Ave
- 634 Peggy Ave
- 603 Peggy Ave