N
Seller's Agent in 2019
Network Team
NOT A VALID MEMBER
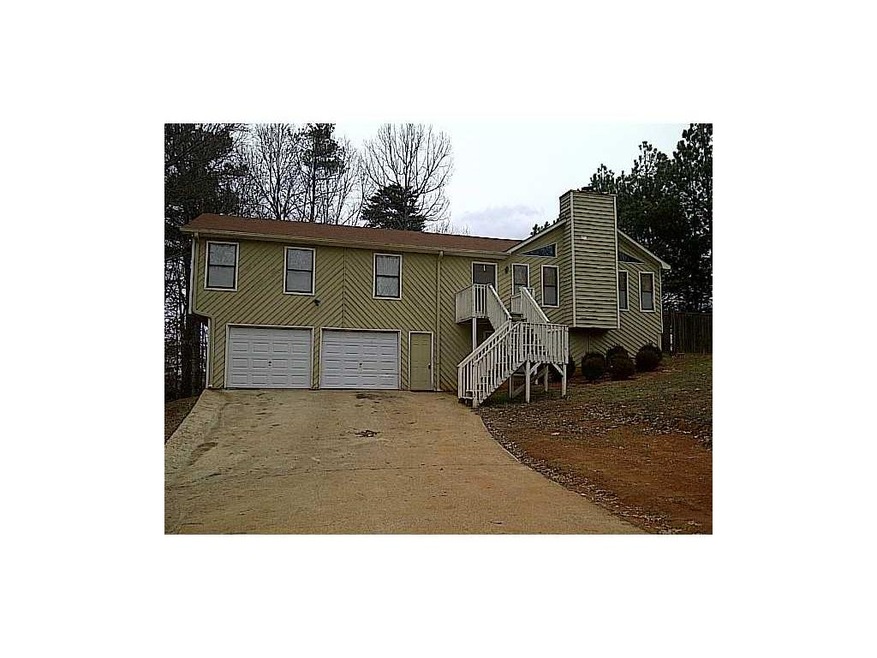
RANCH WITH PARTIAL, FINISHED BASEMENT. NEW PAINT, CARPET AND DECK. SOLD AS-IS. NO DISCLOSURE. SELLER CHOOSES CLOSING ATTORNEY. OFFERS MUST BE ACCOMPANIED BY A WELLS FARGO PRE-QUAL LETTER AND COPY OF EM CHECK. ALL CASH OFFERS ARE ELIGIBLE FOR AN EXPEDITED CLOSING (PENDING CLEAR TITLE AND/OR HAZARD CLAIM RESOLUTION) OF APPROXIMATELY 15 BUSINESS DAYS. OFFER DATES - DAYS 1-7: OFFERS WILL NOT BE REVIEWED. DAYS 8-12: OFFERS ONLY FROM NSP BUYERS, MUNICIPALITIES, NON-PROFIT ORGANIZATIONS AND OWNER-OCCUPANTS WILL BE REVIEWED. DAYS 13+: WE WILL CONSIDER OFFERS FROM ALL BUYERS.
Last Agent to Sell the Property
Advance Equity Group, Inc. License #265594 Listed on: 05/03/2012
| Date | Type | Sale Price | Title Company |
|---|---|---|---|
| Warranty Deed | $247,500 | -- | |
| Warranty Deed | -- | -- | |
| Warranty Deed | -- | -- | |
| Warranty Deed | $87,250 | -- | |
| Warranty Deed | $61,200 | -- | |
| Warranty Deed | $158,000 | -- | |
| Warranty Deed | $4,000 | -- | |
| Warranty Deed | $120,000 | -- |
| Date | Status | Loan Amount | Loan Type |
|---|---|---|---|
| Open | $62,000 | New Conventional | |
| Open | $203,089 | FHA | |
| Closed | $202,303 | FHA | |
| Closed | $201,465 | FHA | |
| Previous Owner | $69,800 | New Conventional | |
| Previous Owner | $31,600 | Stand Alone Refi Refinance Of Original Loan | |
| Previous Owner | $119,750 | No Value Available |
| Date | Event | Price | Change | Sq Ft Price |
|---|---|---|---|---|
| 03/22/2019 03/22/19 | Sold | $247,500 | +1.0% | $85 / Sq Ft |
| 02/16/2019 02/16/19 | Pending | -- | -- | -- |
| 02/11/2019 02/11/19 | For Sale | $245,000 | +180.8% | $84 / Sq Ft |
| 07/05/2012 07/05/12 | Sold | $87,250 | +24.8% | $40 / Sq Ft |
| 05/24/2012 05/24/12 | Pending | -- | -- | -- |
| 05/03/2012 05/03/12 | For Sale | $69,900 | -- | $32 / Sq Ft |
| Year | Tax Paid | Tax Assessment Tax Assessment Total Assessment is a certain percentage of the fair market value that is determined by local assessors to be the total taxable value of land and additions on the property. | Land | Improvement |
|---|---|---|---|---|
| 2024 | $3,490 | $149,104 | $34,000 | $115,104 |
| 2023 | $3,035 | $148,144 | $28,000 | $120,144 |
| 2022 | $2,645 | $107,464 | $21,200 | $86,264 |
| 2021 | $2,608 | $96,544 | $20,000 | $76,544 |
| 2020 | $2,545 | $93,704 | $15,200 | $78,504 |
| 2019 | $2,363 | $83,160 | $15,200 | $67,960 |
| 2018 | $1,999 | $69,920 | $15,200 | $54,720 |
| 2017 | $1,802 | $163,300 | $12,800 | $52,520 |
| 2016 | $1,802 | $154,700 | $12,800 | $49,080 |
| 2015 | $1,703 | $144,800 | $10,000 | $47,920 |
| 2014 | $1,644 | $139,500 | $10,000 | $45,800 |
N
Seller's Agent in 2019
Network Team
NOT A VALID MEMBER

Buyer's Agent in 2019
Natalia Hunter
Atlanta Communities
(678) 835-8568
3 in this area
38 Total Sales
Seller's Agent in 2012
Art Garrison
Advance Equity Group, Inc.
(404) 435-6632
7 in this area
96 Total Sales
Seller Co-Listing Agent in 2012
Laura Garrison
Advance Equity Group, Inc.
(770) 235-0352
36 Total Sales
Buyer's Agent in 2012
RUTH N SWANSON
JDA Realty Services, Inc.
(678) 414-3078
2 in this area
17 Total Sales
Source: First Multiple Listing Service (FMLS)
MLS Number: 5015953
APN: 15N24A-00000-166-000-0000
Disclaimer: Certain information contained herein is derived from information provided by parties other than Homes.com. All information provided is deemed reliable, but is not guaranteed to be accurate and should be independently verified.
![]() Listings identified with the FMLS IDX logo come from FMLS and are held by brokerage firms other than the owner of this website. The listing brokerage is identified in any listing details. Information is deemed reliable but is not guaranteed. If you believe any FMLS listing contains material that infringes your copyrighted work please visit www.fmls.com/dmca to review our DMCA policy and learn how to submit a takedown request. © 2025 First Multiple Listing Service, Inc.
Listings identified with the FMLS IDX logo come from FMLS and are held by brokerage firms other than the owner of this website. The listing brokerage is identified in any listing details. Information is deemed reliable but is not guaranteed. If you believe any FMLS listing contains material that infringes your copyrighted work please visit www.fmls.com/dmca to review our DMCA policy and learn how to submit a takedown request. © 2025 First Multiple Listing Service, Inc.