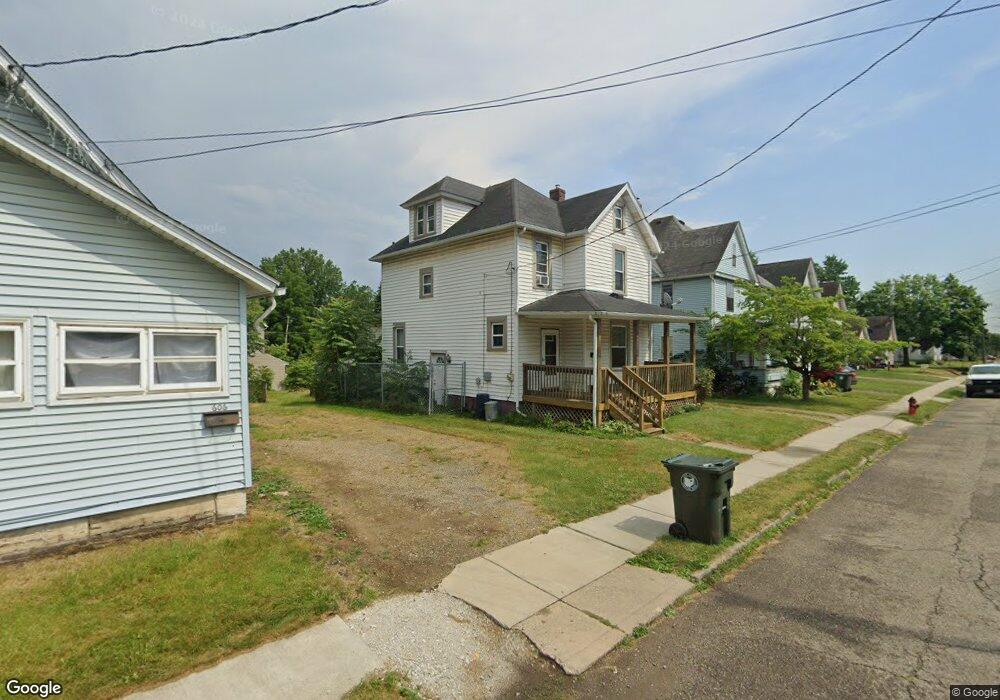
602 Lincoln Ave NW Canton, OH 44708
Edmeyer Park NeighborhoodEstimated Value: $69,000 - $90,000
3
Beds
1
Bath
1,412
Sq Ft
$56/Sq Ft
Est. Value
About This Home
This home is located at 602 Lincoln Ave NW, Canton, OH 44708 and is currently estimated at $79,743, approximately $56 per square foot. 602 Lincoln Ave NW is a home located in Stark County with nearby schools including Harter Elementary School, Early Learning Center @ Schreiber, and Clarendon Intermediate School.
Ownership History
Date
Name
Owned For
Owner Type
Purchase Details
Closed on
Mar 4, 2009
Sold by
Duetsche Bank National Trust Company
Bought by
Carroll Tonya M
Current Estimated Value
Purchase Details
Closed on
Jul 2, 2008
Sold by
Powell Lester H
Bought by
Deutsche Bank National Trust Co and First Franklin Mortgage Loan Trust 2005
Purchase Details
Closed on
Jul 29, 2005
Sold by
Ruth John L and Ruth Mary
Bought by
Powell Lester H
Home Financials for this Owner
Home Financials are based on the most recent Mortgage that was taken out on this home.
Original Mortgage
$57,000
Interest Rate
8.12%
Mortgage Type
Fannie Mae Freddie Mac
Purchase Details
Closed on
Jan 10, 1995
Sold by
Allen Tammy L
Bought by
Ruth John L and Ruth Mary
Purchase Details
Closed on
Mar 14, 1991
Create a Home Valuation Report for This Property
The Home Valuation Report is an in-depth analysis detailing your home's value as well as a comparison with similar homes in the area
Home Values in the Area
Average Home Value in this Area
Purchase History
| Date | Buyer | Sale Price | Title Company |
|---|---|---|---|
| Carroll Tonya M | -- | Accutitle Agency Inc | |
| Deutsche Bank National Trust Co | $30,000 | None Available | |
| Powell Lester H | $57,000 | Quest Title Agency Inc | |
| Ruth John L | $23,000 | -- | |
| -- | $20,000 | -- |
Source: Public Records
Mortgage History
| Date | Status | Borrower | Loan Amount |
|---|---|---|---|
| Previous Owner | Powell Lester H | $57,000 |
Source: Public Records
Tax History Compared to Growth
Tax History
| Year | Tax Paid | Tax Assessment Tax Assessment Total Assessment is a certain percentage of the fair market value that is determined by local assessors to be the total taxable value of land and additions on the property. | Land | Improvement |
|---|---|---|---|---|
| 2025 | $602 | $25,100 | $2,560 | $22,540 |
| 2024 | $1,136 | $25,100 | $2,560 | $22,540 |
| 2023 | $1,107 | $10,470 | $2,030 | $8,440 |
| 2022 | $313 | $10,470 | $2,030 | $8,440 |
| 2021 | $632 | $10,470 | $2,030 | $8,440 |
| 2020 | $594 | $8,820 | $1,750 | $7,070 |
| 2019 | $521 | $8,820 | $1,750 | $7,070 |
| 2018 | $524 | $8,820 | $1,750 | $7,070 |
| 2017 | $513 | $7,850 | $1,650 | $6,200 |
| 2016 | $474 | $7,220 | $1,650 | $5,570 |
| 2015 | $167 | $7,220 | $1,650 | $5,570 |
| 2014 | $516 | $7,350 | $1,680 | $5,670 |
| 2013 | $250 | $7,350 | $1,680 | $5,670 |
Source: Public Records
Map
Nearby Homes
- 435 Hazlett Ave NW
- 202 Lincoln Ave NW
- 201 Park Ave NW
- 1409 8th St NW
- 1405 8th St NW
- 935 Ridge Rd NW
- 1520 11th St NW
- 2425 7th St NW
- 807 Bedford Ave NW
- 813 Bedford Ave NW
- 521 Columbus Ave NW
- 1221 9th St NW
- 0 Harrison Ave NW
- 1435 12th St NW
- 354 Clarendon Ave NW
- 2616 Crown Place NW
- 1236 Perkins Ave NW
- 413 Newton Ave NW
- 607 Rosemont Ct NW
- 1023 Fulton Rd NW
- 606 Lincoln Ave NW
- 516 Lincoln Ave NW
- 512 Lincoln Ave NW
- 603 Kennet Ct NW
- 607 Kennet Ct NW
- 508 Lincoln Ave NW
- 1812 7th St NW
- 613 Kennet Ct NW
- 515 Kennet Ct NW
- 618 Lincoln Ave NW
- 605 Lincoln Ave NW
- 517 Kennet Ct NW
- 515 Lincoln Ave NW
- 1808 7th St NW
- 609 Lincoln Ave NW
- 619 Lincoln Ave NW
- 1804 7th St NW
- 513 Lincoln Ave NW
- 507 Kennet Ct NW
- 613 Lincoln Ave NW