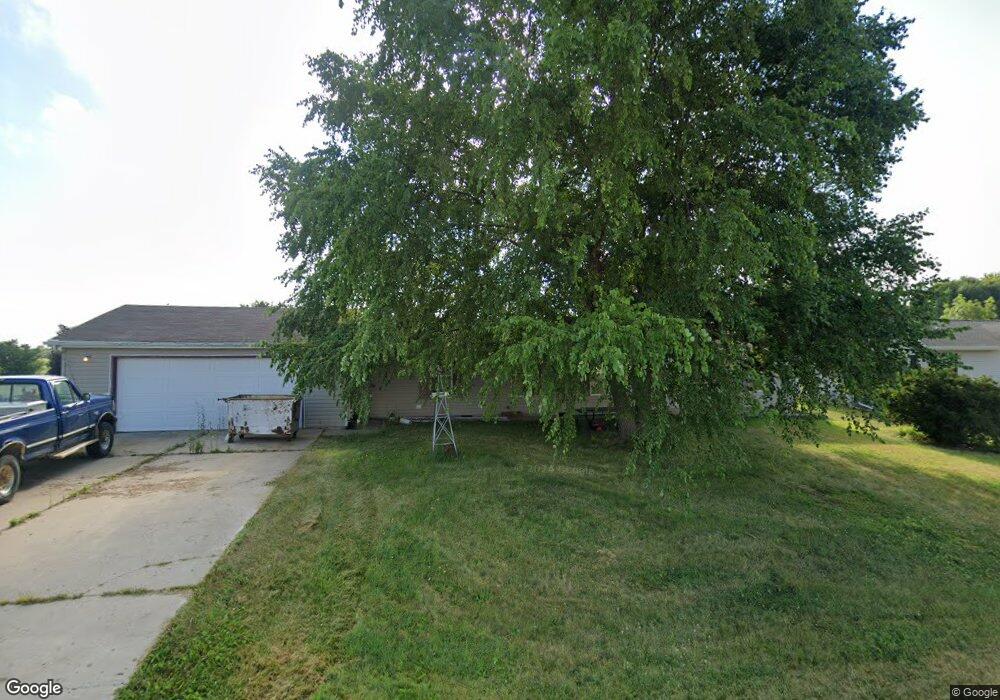
602 N 1st St Terril, IA 51364
Estimated Value: $148,097 - $188,000
3
Beds
2
Baths
1,456
Sq Ft
$111/Sq Ft
Est. Value
About This Home
This home is located at 602 N 1st St, Terril, IA 51364 and is currently estimated at $162,024, approximately $111 per square foot. 602 N 1st St is a home located in Dickinson County with nearby schools including Graettinger-Terril Elementary School, Graettinger-Terril High School, and Graettinger-Terril Middle School.
Ownership History
Date
Name
Owned For
Owner Type
Purchase Details
Closed on
Feb 22, 2005
Sold by
Norton Michael D and Norton Rikki L
Bought by
Bowers John A and Bowers Judy A
Current Estimated Value
Home Financials for this Owner
Home Financials are based on the most recent Mortgage that was taken out on this home.
Original Mortgage
$67,500
Outstanding Balance
$41,188
Interest Rate
8.95%
Mortgage Type
Adjustable Rate Mortgage/ARM
Estimated Equity
$120,836
Create a Home Valuation Report for This Property
The Home Valuation Report is an in-depth analysis detailing your home's value as well as a comparison with similar homes in the area
Home Values in the Area
Average Home Value in this Area
Purchase History
| Date | Buyer | Sale Price | Title Company |
|---|---|---|---|
| Bowers John A | $90,000 | None Available |
Source: Public Records
Mortgage History
| Date | Status | Borrower | Loan Amount |
|---|---|---|---|
| Open | Bowers John A | $67,500 |
Source: Public Records
Tax History Compared to Growth
Tax History
| Year | Tax Paid | Tax Assessment Tax Assessment Total Assessment is a certain percentage of the fair market value that is determined by local assessors to be the total taxable value of land and additions on the property. | Land | Improvement |
|---|---|---|---|---|
| 2025 | $1,350 | $134,900 | $8,100 | $126,800 |
| 2024 | $1,350 | $100,100 | $6,700 | $93,400 |
| 2023 | $1,272 | $100,100 | $6,700 | $93,400 |
| 2022 | $1,234 | $80,400 | $3,700 | $76,700 |
| 2021 | $1,234 | $80,400 | $3,700 | $76,700 |
| 2020 | $976 | $67,500 | $3,300 | $64,200 |
| 2019 | $982 | $67,500 | $3,300 | $64,200 |
| 2018 | $988 | $66,400 | $2,900 | $63,500 |
| 2017 | $988 | $66,400 | $2,900 | $63,500 |
| 2016 | $992 | $67,100 | $2,900 | $64,200 |
| 2015 | $970 | $67,100 | $2,900 | $64,200 |
| 2014 | $1,012 | $70,700 | $3,500 | $67,200 |
| 2013 | $932 | $69,000 | $3,500 | $65,500 |
Source: Public Records
Map
Nearby Homes