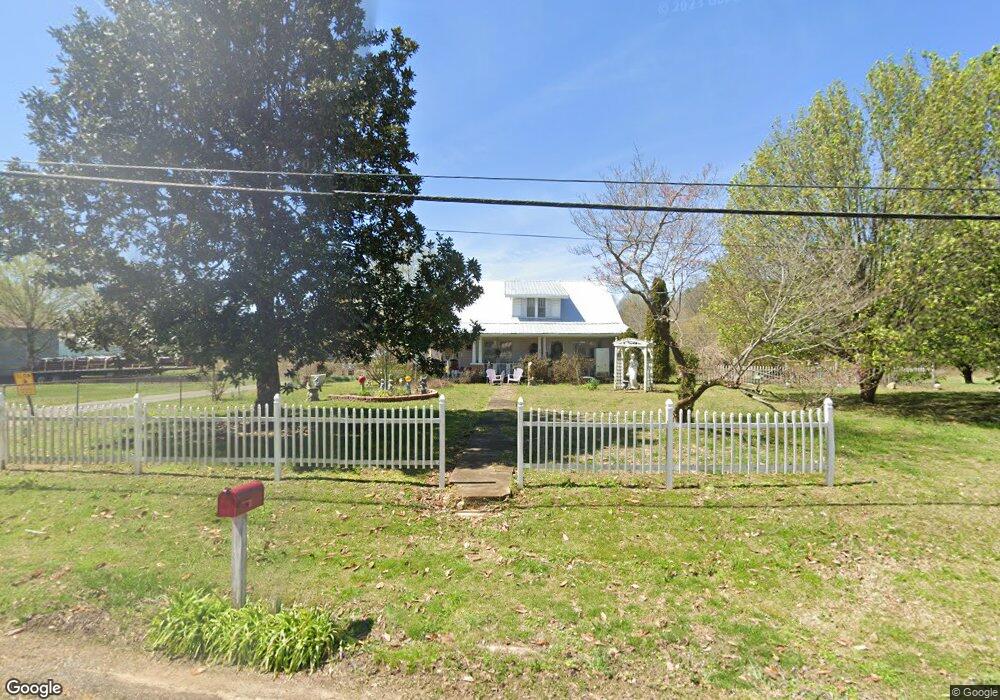
602 N Main St Saint Joseph, TN 38481
Estimated Value: $120,000 - $154,000
--
Bed
1
Bath
1,747
Sq Ft
$75/Sq Ft
Est. Value
About This Home
This home is located at 602 N Main St, Saint Joseph, TN 38481 and is currently estimated at $131,125, approximately $75 per square foot. 602 N Main St is a home located in Lawrence County with nearby schools including South Lawrence Elementary School, Lawrenceburg Public Elementary School, and Ingram Sowell Elementary School.
Ownership History
Date
Name
Owned For
Owner Type
Purchase Details
Closed on
Jan 18, 2017
Sold by
Markus Patricia
Bought by
Markus Patricia
Current Estimated Value
Purchase Details
Closed on
Oct 12, 2001
Sold by
Bank One
Bought by
Patricia Markus
Purchase Details
Closed on
Sep 7, 2000
Sold by
Wilkins Charles R
Bought by
Bank One
Purchase Details
Closed on
Sep 23, 1999
Sold by
Frank Jenkins
Bought by
Wilkins Charles R
Purchase Details
Closed on
Dec 23, 1998
Bought by
Wilkins Charles R and Wilkins June D
Purchase Details
Closed on
Feb 26, 1996
Sold by
Ulva Rhodes
Bought by
Frank Jenkins
Purchase Details
Closed on
Apr 10, 1995
Sold by
Clifford Roberson Thomas
Bought by
Ulva Rhodes
Purchase Details
Closed on
Oct 16, 1991
Bought by
Roberson Thomas Clifford and Roberson Margaret
Purchase Details
Closed on
Feb 14, 1984
Bought by
Roberson O B Clifford Howard Clinto
Create a Home Valuation Report for This Property
The Home Valuation Report is an in-depth analysis detailing your home's value as well as a comparison with similar homes in the area
Home Values in the Area
Average Home Value in this Area
Purchase History
| Date | Buyer | Sale Price | Title Company |
|---|---|---|---|
| Markus Patricia | -- | -- | |
| Patricia Markus | $23,000 | -- | |
| Bank One | $31,500 | -- | |
| Wilkins Charles R | -- | -- | |
| Wilkins Charles R | $35,000 | -- | |
| Frank Jenkins | $20,000 | -- | |
| Ulva Rhodes | $15,000 | -- | |
| Roberson Thomas Clifford | -- | -- | |
| Roberson O B Clifford Howard Clinto | -- | -- |
Source: Public Records
Tax History Compared to Growth
Tax History
| Year | Tax Paid | Tax Assessment Tax Assessment Total Assessment is a certain percentage of the fair market value that is determined by local assessors to be the total taxable value of land and additions on the property. | Land | Improvement |
|---|---|---|---|---|
| 2025 | $761 | $30,725 | $0 | $0 |
| 2024 | $761 | $30,725 | $2,000 | $28,725 |
| 2023 | $761 | $30,725 | $2,000 | $28,725 |
| 2022 | $761 | $30,725 | $2,000 | $28,725 |
| 2021 | $498 | $13,525 | $2,000 | $11,525 |
| 2020 | $498 | $13,525 | $2,000 | $11,525 |
| 2019 | $498 | $13,525 | $2,000 | $11,525 |
| 2018 | $498 | $13,525 | $2,000 | $11,525 |
| 2017 | $498 | $13,525 | $2,000 | $11,525 |
| 2016 | $500 | $13,525 | $2,000 | $11,525 |
| 2015 | $470 | $13,525 | $2,000 | $11,525 |
| 2014 | $413 | $11,875 | $2,000 | $9,875 |
Source: Public Records
Map
Nearby Homes
- 10 Fowler Dr
- 1009 N Main St
- 604 S Main St
- 3654 U S 43
- 0 S Old Military Rd Unit LotWP001 23902453
- 0 S Old Military Rd
- 599 Countryside Dr
- 244 Beartown Rd
- 236 Beartown Rd
- 200 Beartown Rd
- 188 Beartown Rd
- 176 Beartown Rd
- 516 Barney Ln
- 0 Kitty Meyer Ln
- 200 Bear Dr
- 110 Kitty Meyer Ln
- 624 2nd Ave S
- 8224 County Road 94
- 0 Co Rd 380
- 45 County Road 338
- 605 N Main St
- 601 N Main St
- 418 Wilsford Dr
- 401 McMurtrey St
- 306 Roberson Ln
- 611 N Main St
- 404 McMurtrey St
- 415 N Main St
- 417 Wilsford Dr
- 407 McMurtrey St
- 406 McMurtrey St
- 409 Wilsford Dr
- 408 McMurtrey St
- 3 Mcintyre Rd
- 402 S Main St
- 402 N Main St
- 409 McMurtrey St
- 4 Mcintyre Rd
- 5 Mcintyre Rd
- 303 Rose St